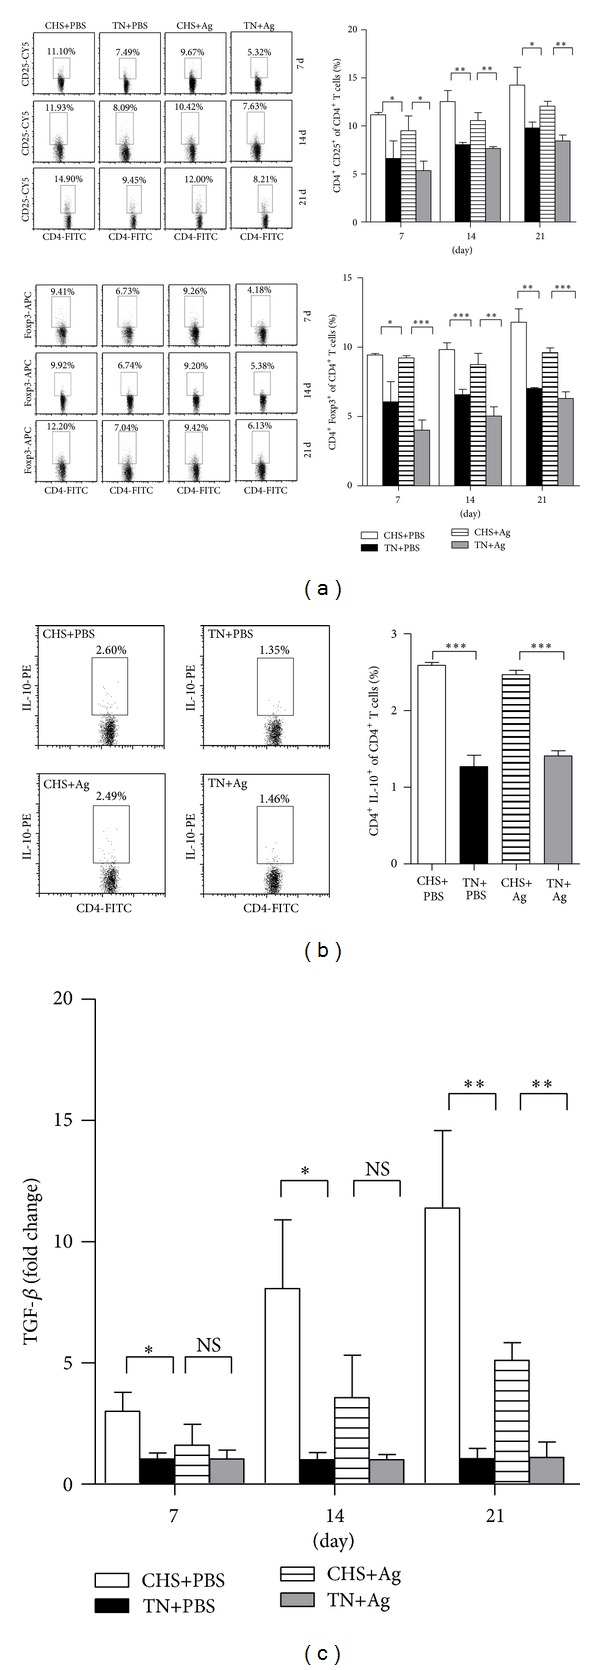
Figure 4.

CHS regulates Tregs prevalence. Splenic T cells from each group (n = 3) were isolated on the indicated days postprimary immunization and then analyzed by flow cytometry. (a) Percentages of CD25+ and Foxp3+ cells in CD4+ T cells were calculated at the indicated time points. Results shown are pooled from three independent repeats. (b) Intracellular staining of IL-10+ CD4+ T cells on day 21 was performed (stimulated with a viral-specific antigen for 6 h in vitro before being analyzed by flow cytometry). Representative plots showing the percentages of positive T cells are shown on the left. Data from all experiments are summarized in bar graphs to the right. (c) The expression levels of TGF-β in the CD4+ cells of CHS groups were analyzed by real-time PCR at indicated time points. Data are presented as relative changes in gene expression (fold) normalized to the TN groups and are one representative from three independent experiments.
