
Figure 2.
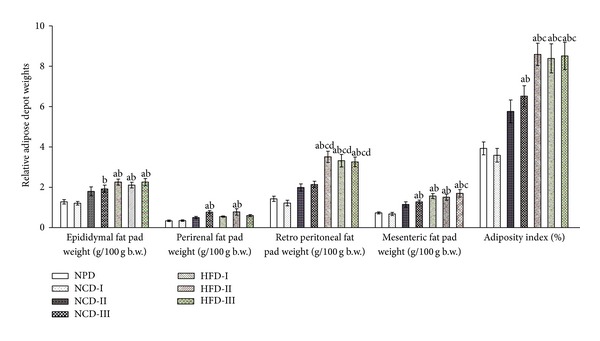
Effect of different experimental diets on adiposity in albino Wistar rats. Adiposity in normal pellet diet (NPD), normal control diets (NCDs I, II, and III), and high fat diets (HFDs I, II, and III) groups after 12 weeks of study period. Values are expressed as mean ± SEM. a P ≤ 0.05 versus NPD, b P ≤ 0.05 versus NCD-I, c P ≤ 0.05 versus NCD-II, and d P ≤ 0.05 versus NCD-III; adiposity index = sum of the fat pads/(body weight-fat pad weight) × 100.