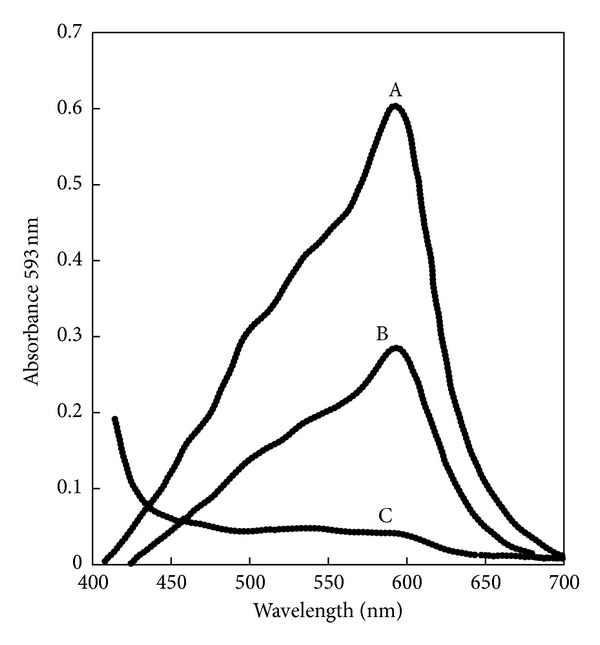
Figure 1.

Spectral scan for xanthurenic acid after reacting with Fe3+-TPTZ complex in acidic buffer (pH = 3.6) exhibiting a maximum absorption peak at 593 nm. The absorption peak represents the formation of Fe2+-TPTZ (intense blue color). A = 8 μg XA in 0.1 mL MeOH versus reagent blank, B = 4 μg XA in 0.1 mL MeOH versus reagent blank, and C = reagent blank versus H2O.
