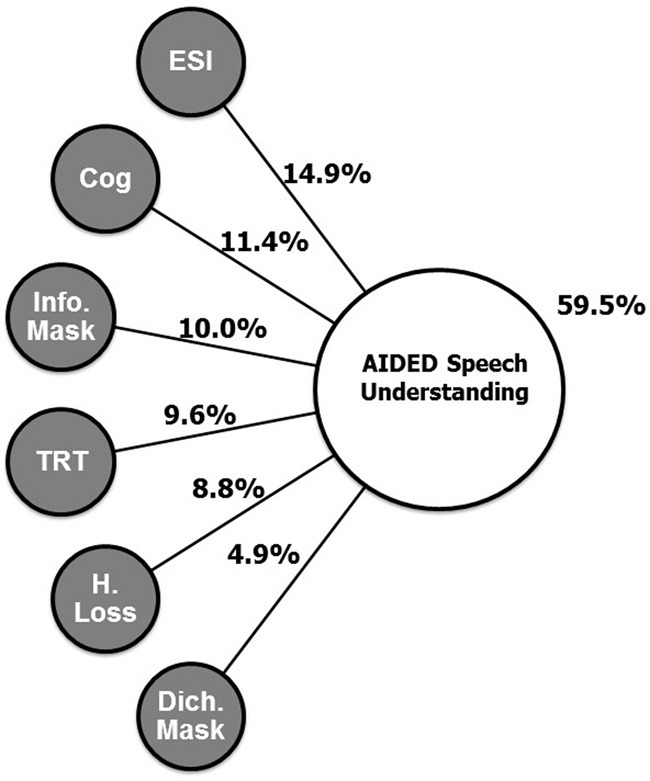
Figure 2.

Schematic illustration of the best-fitting regression model from the dominance analysis showing the total variance explained for aided speech understanding (59.5%) and the relative proportions of variance associated with each predictor variable. See text for further descriptions of the predictors and the analyses.
