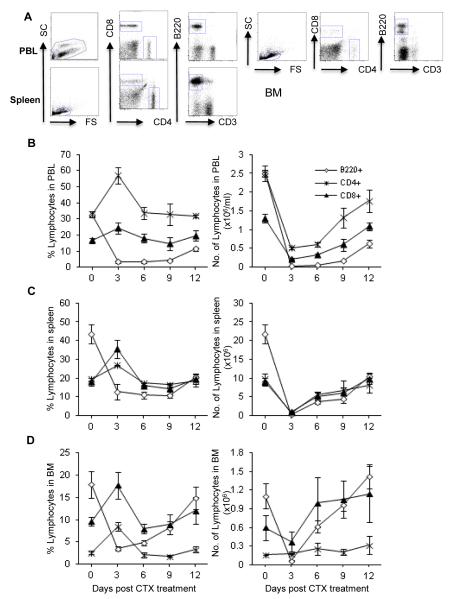
Fig. 4. Effect of CTX treatment on the relative and absolute numbers of CD4+ and CD8+ T cells and B220+ B cells.
C57BL/6 mice were injected i.p. with PBS or CTX (4 mg/mouse). The average of the data from PBS-treated mice (control group) is depicted as day 0 in the figure. At the indicated time points, mice were bled to collect PBL and then sacrificed to harvest spleen and BM. Leucocytes were counted, stained with mAbs against the indicated cell markers, and then analyzed by flow cytometry. The total leukocytes were gated after exclusion of dead cells and from which the frequency of the indicated cell populations was analyzed in the blood of control mice treated with PBS as a representative dot plot analysis shown in (A). The relative and absolute numbers depicted in PBL (A), spleen (B), and BM (C) as described in the legend of Fig. 2. Data represent the mean ± SD (n = 4).

