
Figure 2. Cellular Phenotypes.
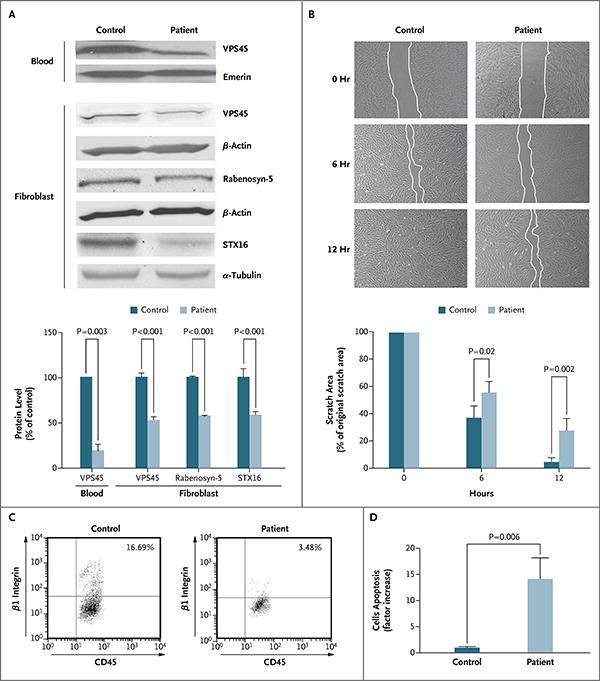
In Panel A, immunoblot analysis and graphic representation of densitometry show reduced expression of VPS45 in peripheral blood and fibroblasts and reduced expression of the interacting partners of VPS45 — rabenosyn-5 and syntaxin-16 (STX16) — in fibroblasts from one of the affected patients as compared with a control. Loading was controlled by immunoblotting the same membrane for emerin, β-actin, or α-tubulin. Densitometry was performed with the use of the ImageJ 1.45s Gel Analysis tool (National Institutes of Health). Panel B shows impaired cell motility. Fibroblasts were grown on coverslips coated with fibronectin. The cultures were “wounded” by introducing a scratch (approximately 800 μm in width) across the field of cells; the same field of cells was imaged immediately, after 6 hours, and after 12 hours. The fibroblasts from Patient B-II-9 migrated significantly more slowly toward the wounded area than did control cells (similar results were obtained in fibroblasts from Patient E-II-1). Each experiment was performed in triplicate, and similar results were obtained in four independent experiments. The histogram shows the quantification of the area of the scratch at 0, 6, and 12 hours. Panel C shows flow-cytometric analysis for CD45 and β1 integrin that was performed on peripheral blood in a patient and a control. The patient's blood (with VPS45-mutant neutrophils) has far fewer cells that are positive for β1 integrin. Panel D shows apoptosis in fibroblasts from a patient and a control. Staining for activated caspase 3, an in situ fluorescein isothiocyanate marker and indicator of apoptosis, was increased by a factor of 14 in fibroblasts from the patient as compared with control cells. In Panels A, B, and D, T bars indicate the standard deviation.