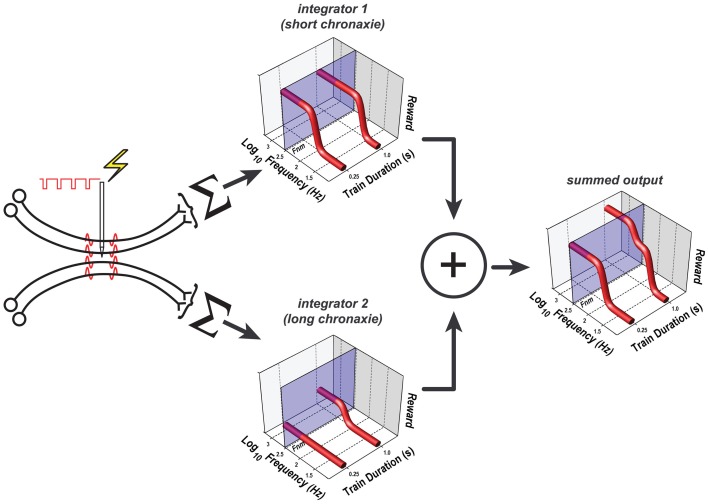
Figure 12.
The dual-integrator model. Only the components that differ from those in Figure 11 are shown; the remaining components are common to the single- and dual-integrator models. The rewarding effect arises from the direct activation of two subpopulations of neurons, each of which projects to a different spatio-temporal integrator; the weighted outputs of these two integrators are pooled. One integrator has a shorter chronaxie than the other, which renders it less sensitive to the reduction of the train duration from 1 to 0.25 s. Note that the pulse-frequency axis is inverted: the frequency decreases from left to right. The translucent blue planes are positioned at FNear Max (Fnm), the pulse frequency beyond which reward intensity approaches asymptote. At both the short and long train durations, the growth of reward intensity at the output of integrator 1 (upper 3D graph) is largely complete at pulse frequencies lower than FNear Max. Although reward growth at the output of integrator 2 is also largely complete at pulse frequencies lower than FNear Max when the train duration is 1 s (lower 3D graph), reward growth has not yet begun at this pulse frequency when the train duration is 0.25 s. Thus, reward fails to grow as a function of pulse frequency when the train duration is short, and the summed output of the two integrators (right-hand 3D graph) is lower at the short train duration than at the long. The parameters used to generate the reward-growth functions in Figure 12 are from the fit of the dual-integrator model to the data from rat C17 (Figures 13, 14).

