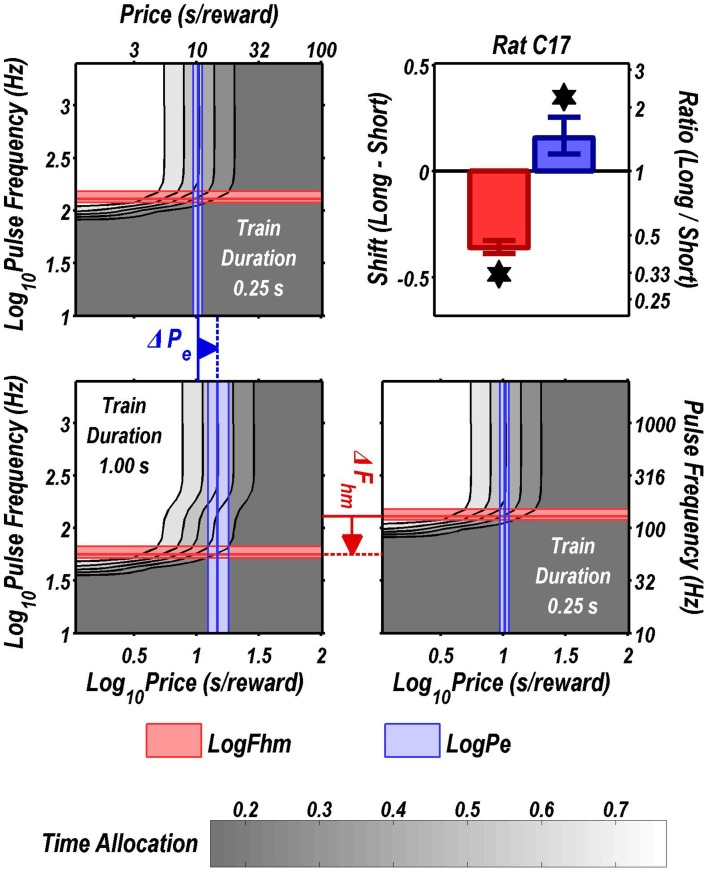
Figure 14.
Shifts of the reward mountain in the fit of the dual-integrator model to the data from rat C17. The contour graph for the long-duration (1 s) train is shown in the lower left. For comparison the contour graph for the short-duration (0.25 s) train is shown twice, in the upper left and lower right. For clarity, the sampling vectors (the series of points designating the pulse frequencies and prices tested) have been omitted. These can be seen in Figures 3, 13. For comparison with the fit of the single-integrator model to this same dataset, see Figure 3. Note the wiggles in the contour lines for the longer train duration (lower left), which are due to the offset between the pulse frequencies over which reward intensity grows in the two integrators (upper and lower 3D graphs in Figure 12). The Pe parameter determines the location along the price axis, whereas the Fhm parameter determines the location of the mountain along the pulse-frequency axis. The vertical blue line represents the estimate of Pe, and the surrounding band represents the corresponding 95% confidence interval. The horizontal red line represents the estimate of Fhm, and the surrounding band represents the corresponding 95% confidence interval. The bar graph shows the mean shifts in the location parameters due to the increase in train duration from 0.25 to 1 s. As this figure shows, the dual-integrator model can account for the observed shift of the mountain rightward along the price axis when the train duration is increased from 0.25 to 1 s.

