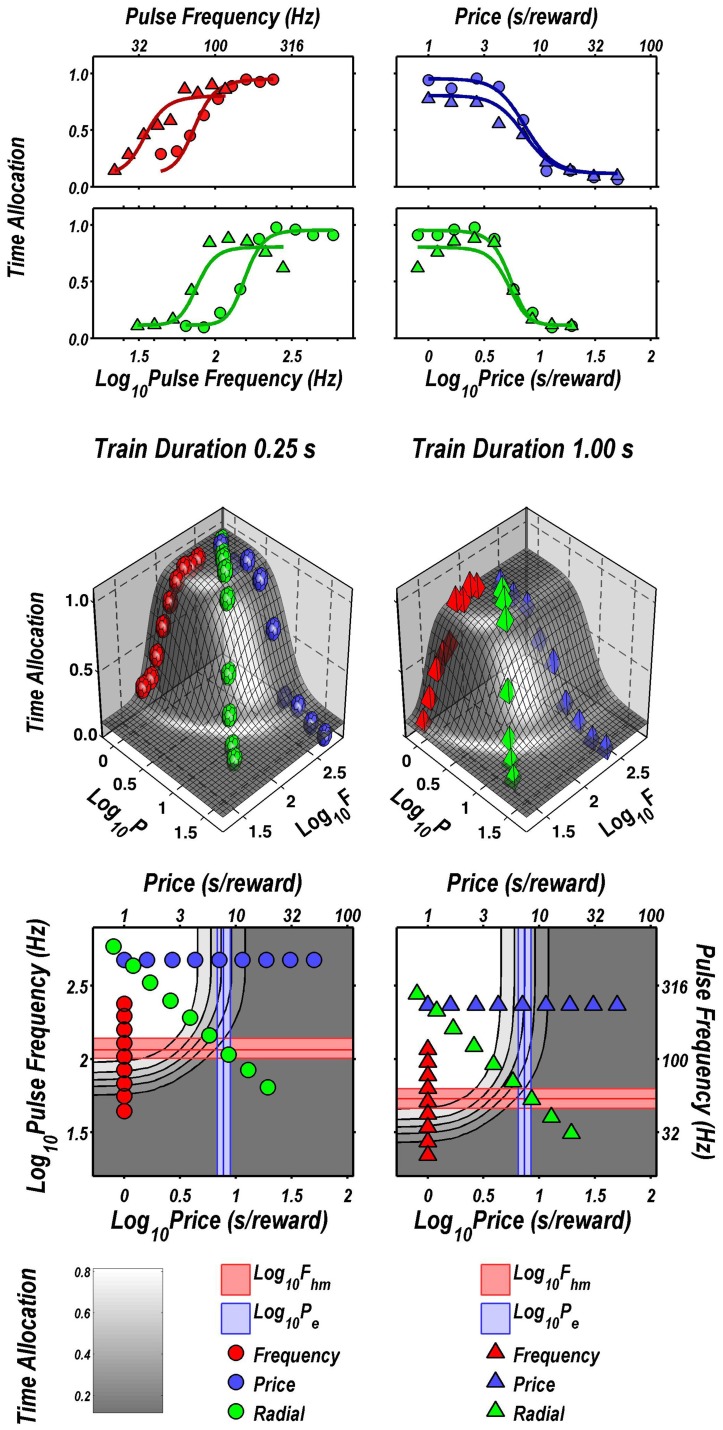
Figure 2.
Sample two- and three-dimensional representations of the data from Rat C26. The top four panels show the set of “pseudo-sweeps” (see section Behavioral Testing) comprising the reward mountain. Upper left: time allocated to reward pursuit as a function of pulse frequency (red circles: 0.25 s duration; red triangles: 1.0 s duration) with price held constant. Shortening the train duration shifts the curve toward higher pulse frequencies. Upper right: time allocated to reward pursuit as a function of price with pulse frequency held constant at a high value. This is one of the three cases in which changes in train duration did not alter the position of the mountain along the price axis (blue circles: 0.25 s duration; blue triangles: 1.0 s duration). Second row: time allocated to reward pursuit as a function of conjoint variation in both pulse frequency and price (green circles: 0.25 s duration; green triangles: 1.0 s duration). Time allocation along the radial pseudo-sweep is plotted against pulse frequency (left panel) and price (right panel). Third row: 3D surfaces showing how time allocation varies as a function of pulse frequency and price. Individual data means along the pulse-frequency (red), price (blue), and radial (green) sweeps are designated by polyhedrons (0.25 s trains) or pyramids (1.0 s trains). Bottom row: contour graphs corresponding to the surfaces in the row above. The vertical blue line represents the estimate of Pe, and the surrounding band represents the corresponding 95% confidence interval. The horizontal red line represents the estimate of Fhm, and the surrounding band represents the corresponding 95% confidence interval.

