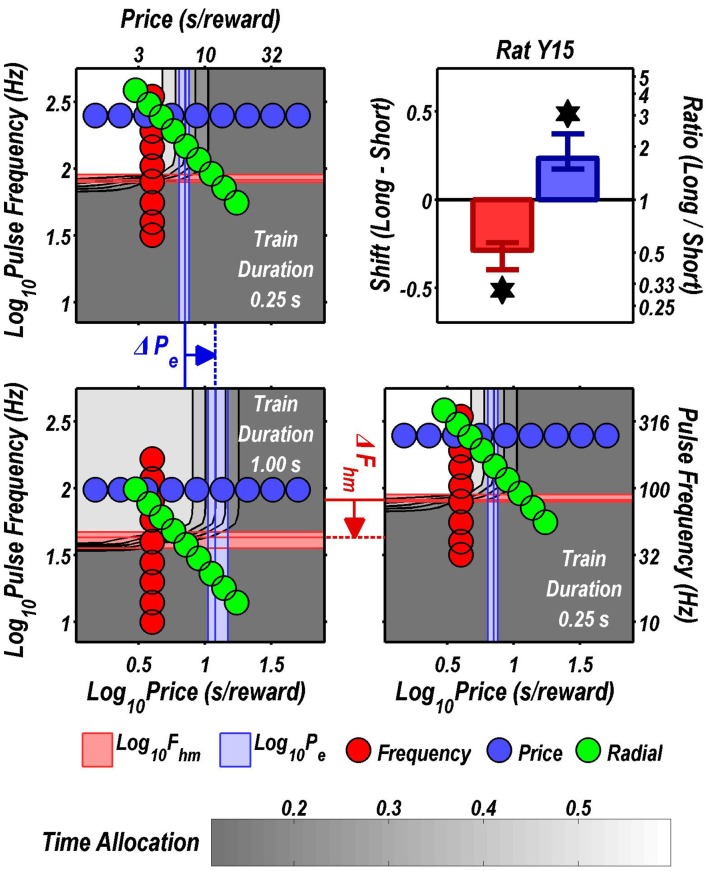
Figure 8.
Shifts of the reward mountain. The contour graph for the long-duration (1 s) train is shown in the lower left. For comparison the contour graph for the short-duration (0.25 s) train is shown twice, in the upper left and lower right. The Pe parameter determines the location along the price axis, whereas the Fhm parameter determines the location of the mountain along the pulse-frequency axis. The vertical blue line represents the estimate of Pe, and the surrounding band represents the corresponding 95% confidence interval. The horizontal red line represents the estimate of Fhm, and the surrounding band represents the corresponding 95% confidence interval. The bar graph shows the mean shifts in the location parameters due to the increase in train duration from 0.25 to 1 s along with the associated 95% confidence intervals. *Indicates that the 95% confidence interval does not include zero.

