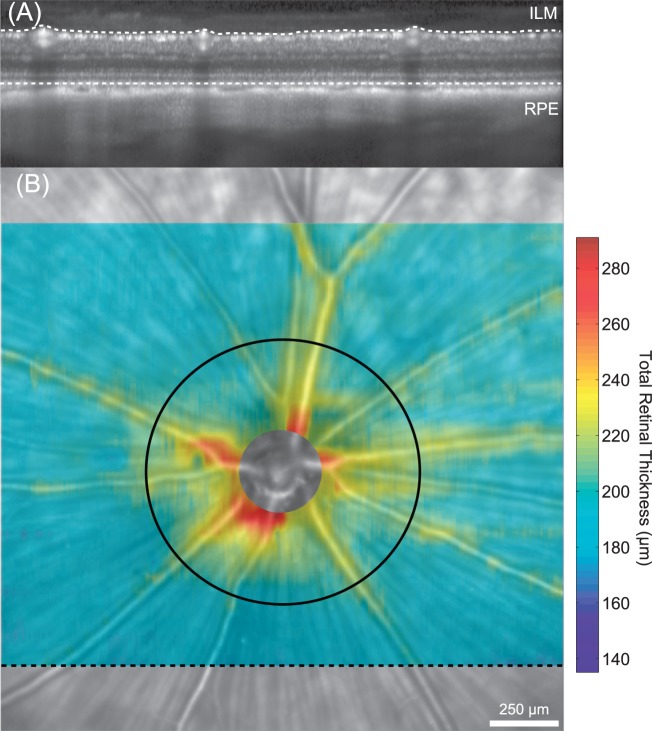
Figure 3.
Total retinal thickness measurements in the healthy brown Norway rat. (A) Total retinal thickness was measured from volumetric SD-OCT scans (25°h × 30°w) comprised of 31 horizontally oriented b-scans. The black dashed line in (B) shows the location where the OCT image (A) was acquired. Total retinal thickness was calculated as the distance from the ILM to the RPE. (B) Spatial thickness maps were generated from bilinear interpolation of thickness measurements between successive B-scans. The retinal thickness map is superimposed on top of the scanning laser ophthalmoscope image and shows that thicker measurements are consistently located around blood vessels and near the optic nerve head. The black circle (diameter = 1 mm) was placed on the optic nerve head center and shows the location where mean thickness measurements were calculated and compared between animals.

