
Fig. 3.—
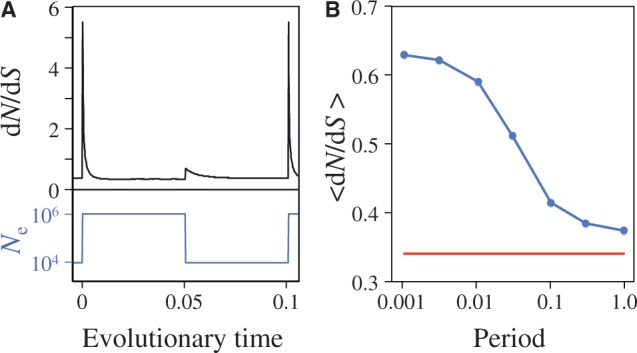
(A) Instantaneous values of dN/dS during fluctuations in effective population size, when the fluctuations have a period of 0.1. Both increases and decreases in population size cause transient increases in the rate of evolution. Periods represent durations in evolutionary time corresponding to expected number of base substitutions per nucleotide position under conditions of neutral evolution. (B) Averaged values of  for fluctuating population sizes, as a function of the period of the fluctuations (blue). The value of
  when the population is fixed at
  = 106 is shown for comparison (red).