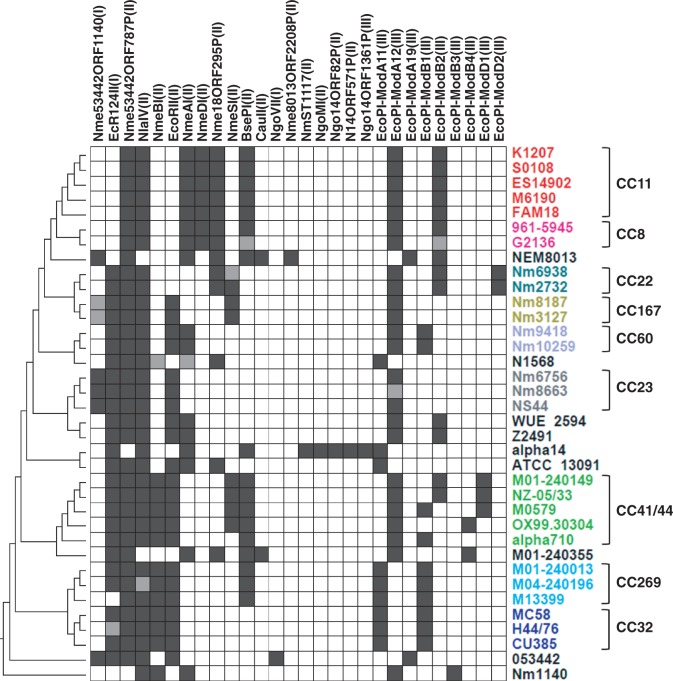
Fig. 5.—
Presence/absence matrix of 28 RMSs. Each row of the matrix represents one Nm genome, and is color coded as per figure 1. Each column represents one RMS with the RMS type in parenthesis. The names of RMSs corresponded to the common names used in the literature, and to the reference names used in the REBASE database when common names could not be found in the literature. A black square indicates the presence of an RMS in the strain, while white indicates absence. A gray square indicates an RMS containing a disrupted restriction or modification gene. The topology on the left was the same as figure 1A.

