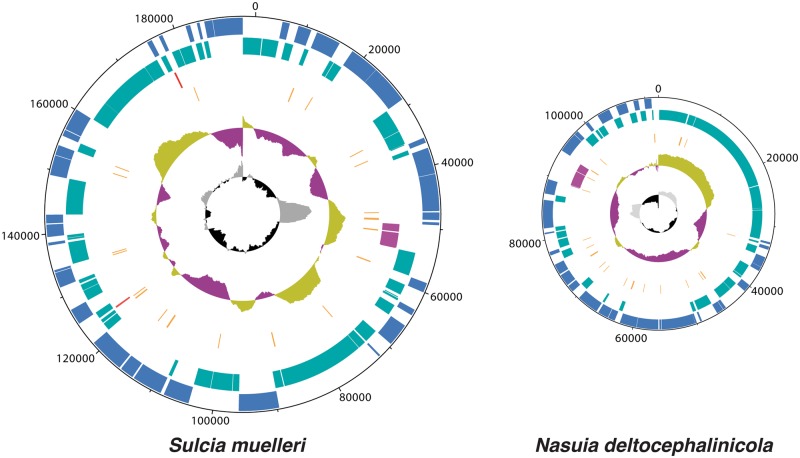
Fig. 3.—
Genome map of the co-primary symbionts of Macrosteles quadrilineatus: Sulcia-ALF (left) and Nasuia-ALF (right). Genomes are scaled relative to nucleotide count. The outermost track (blue) shows genes coded on the plus strand, whereas the adjacent tracks (teal) show genes coded on the minus strand. The other tracks show RNA genes, including the rRNA operons (purple), ncRNA (red), and tRNA (orange). The two graphs show GC skew (outermost: green = values above genome average, purple = below genome average) and GC content (innermost: gray = values above genome average, black = below genome average). Plots were created with DNAPlotter (Carver et al. 2009).

