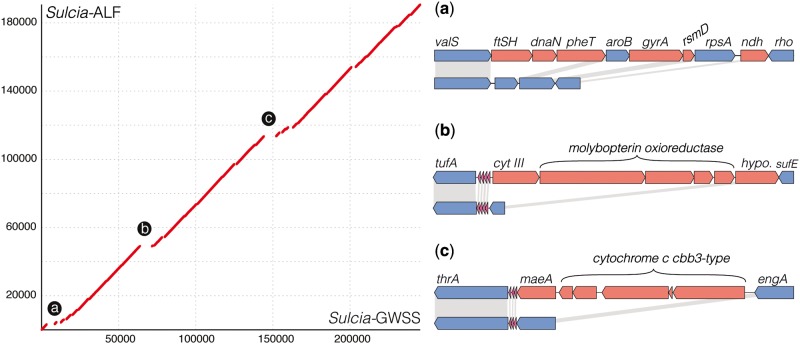
Fig. 4.—
Synteny plot showing gene order conservation and gene loss between Sulcia-ALF (Macrosteles quadrilineatus) and Sulcia-GWSS (Homalodisca coagulata). Axes are in the number of nucleotides. Lettered breaks correspond to gene maps on the right hand side. Plots a–c show specific gene loss between Sulcia-GWSS (top) and Sulcia-ALF (bottom). Conserved orthologs are colored blue connected with gray shading, whereas genes that are lost in Sulcia-ALF are shown in red.

