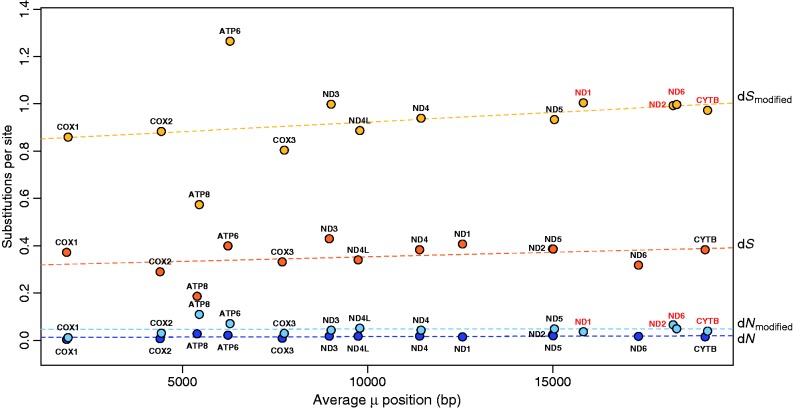
Fig. 3.—
Plot of average mutation position (x axis) and average nonsynonymous (dN) and synonymous (dS) substitution rates (y axis) for each mitochondrial gene for both normal and modified genomes. Average dN for normal mitochondrial genomes are dark blue, average dN for modified mitochondrial genomes are light blue, average dS for normal mitochondrial genomes are dark orange, and average dS for modified mitochondrial genomes are light orange. The mutation position for a given gene is the average time spent single stranded measured in base pairs. Genes within modified genomes do not significantly differ in mutation position from genes within normal genomes, with the exception of four genes (labeled red): average mutation positions of ND1 and ND2 increase by 3.3 kb within modified genomes. Mutation position of ND6 either decreases by 4.0 kb or increases by up to 8.5 kb within rearranged genomes, depending on lineage-specific gene rearrangements. Mutation position of CYTB either decreases by 1.2 kb or increases by up to 2.5 kb, depending on lineage-specific gene rearrangements. Despite the presence of a weak mutational gradient, no significant relationship exists between average mutation position and substitution rates (dN or dS) in salamanders. Thus, change in mutation position has no significant impact on rates of molecular evolution.

