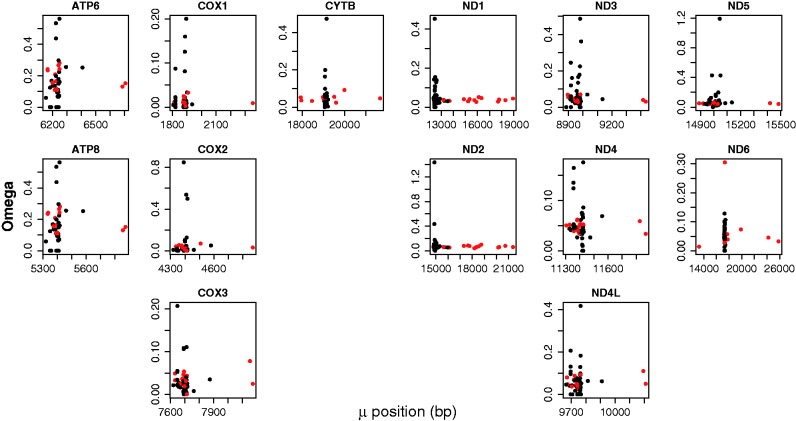
Fig. 4.—
Plots of levels of selective constraint, represented by ω (dN/dS), acting on the 13 mitochondrial genes for both normal (black) and modified (red) genomes. Omega plots for each gene are grouped to reflect protein functional complexes (i.e., COX1-3, ATP6&8, CYTB, ND1-6, and 4L). ω values for modified genomes are not larger than those for normal genomes, showing that genes in modified genomes are not experiencing weaker selective constraint.

