
Fig. 2.—
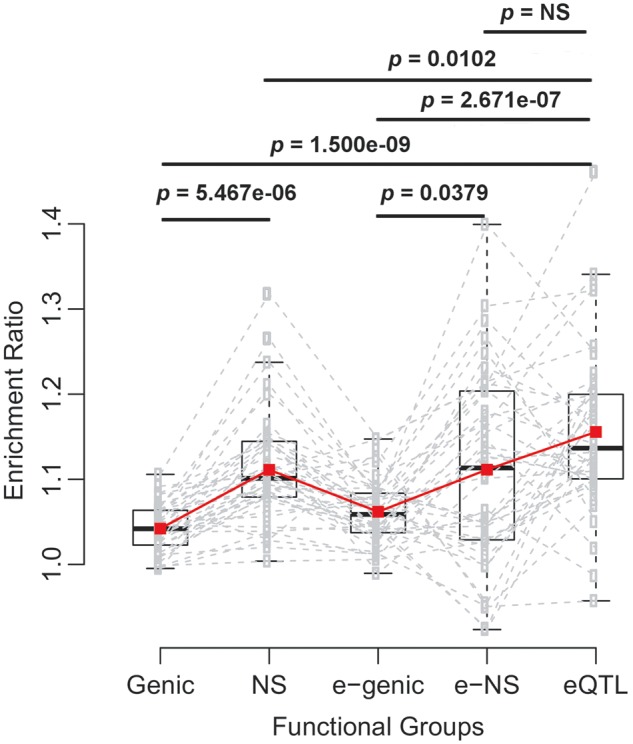
ERs of different types of SNPs in the tail of the transformed rank statistic. Five types of SNPs were analyzed, including genome-wide genic and NS SNPs (Genic and NS), genic and NS SNPs for genes with eQTLs (e-genic and e-NS), and eQTLs whose associated genes were included in our analyses. For each type of SNPs, ERs were calculated for all 42 environmental factors. Each dashed line connects ERs calculated from one environmental factor. The red line connects mean ERs of each SNP group. The P values are for generalized paired Z tests of whether the mean ERs of one group is larger than that of the other group. The tail cutoff is 5%. The patterns are similar for cutoffs of 1% and 0.5% (see supplementary fig. S6, Supplementary Material online).