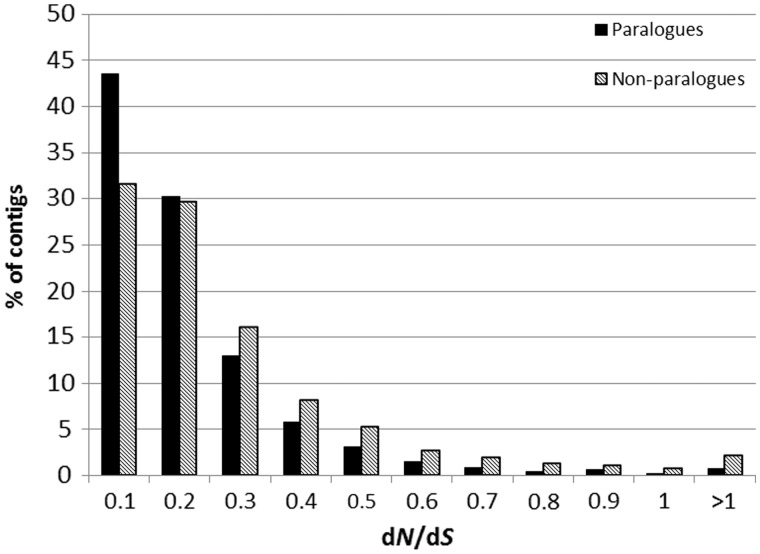
Fig. 2.—
Genes with expressed paralogs (black) in the transcriptome have significantly lower dN/dS than those without (gray). The x axis values are the maximum value of dN/dS in each bin range. The percentage of contigs (in each of the two classes, i.e., with or without paralogs) in each bin are displayed on the y axis.

