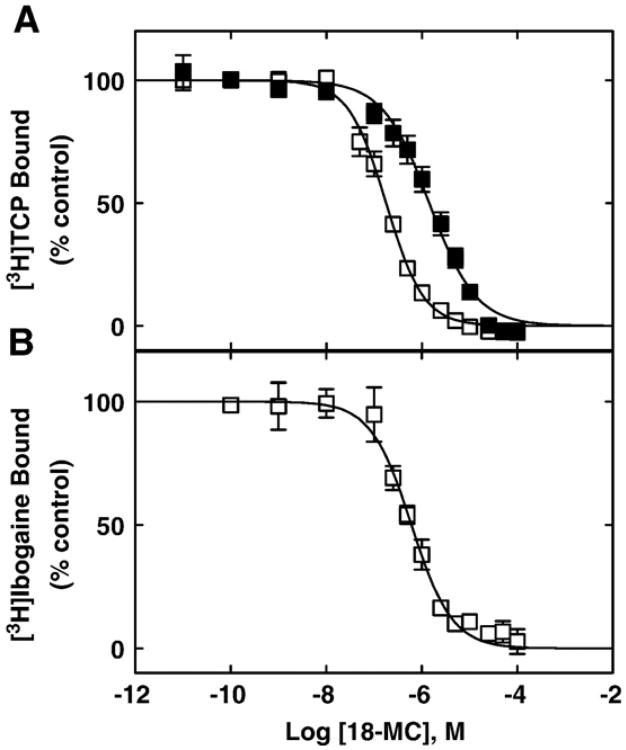
Fig. 4.
18-MC-induced inhibition of (A) [3H]TCP and (B) [3H]ibogaine binding to Torpedo AChRs in different conformational states. AChR-rich membranes (0.3 μM) were equilibrated (2 h) with 4 nM [3H]TCP in the presence of 1 mM CCh (□) (desensitized/CCh-bound state) or 1 μM α-BTx (■) (resting/α-BTx-bound state), or alternatively with 19 nM [3H]ibogaine in the presence of 1 mM CCh (□), and increasing concentrations of 18-MC. Nonspecific binding was determined in the presence of 100 μM PCP. Each plot is the combination of two separated experiments each one performed in triplicate, where the error bars represent the standard deviation (S.D.) values. From these plots the IC50 and nH values were obtained by nonlinear least-squares fit according to Eq. (2). Subsequently, the Ki values were calculated using Eq. (3). The calculated Ki and nH values are summarized in Table 2.

