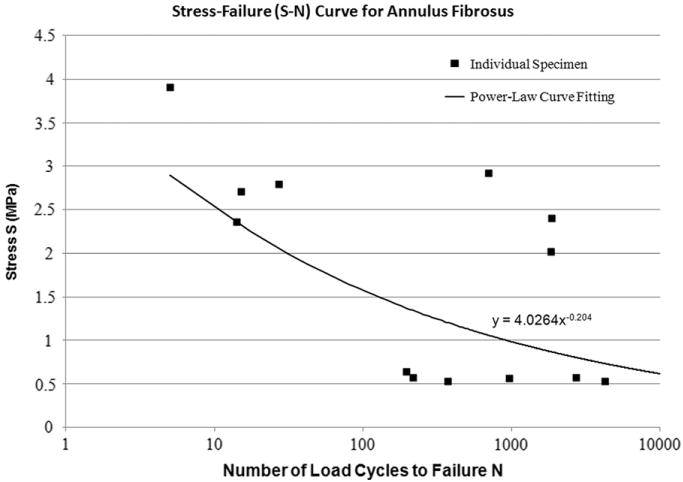
Fig. 2.

Stress–Failure (S–N) curve for annulus fibrosus. Annulus specimens from different discs were cyclically loaded in tension for up to 10,000 cycles by Green et al. (1993). Stress level and the numbers of load cycles to failure are plotted for each specimen. A trend line based on power function represents the fatigue behaviour of the annulus ground material.
