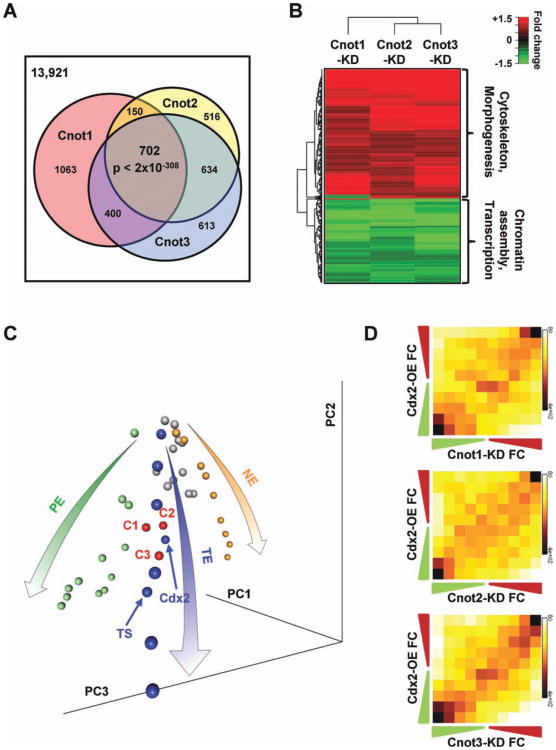
Figure 3.
Silencing Cnot1, Cnot2, or Cnot3 induce differentiation primarily into the TE lineage. (A): Cnot1, Cnot2, or Cnot3 knockdown induced similar gene expression changes. Venn diagram of genes that showed 1.5-fold changes after Cnot1, Cnot2, or Cnot3 knockdown. (B): Heatmap of expression changes for genes that are commonly affected by Cnot1, Cnot2, and Cnot3 knockdown. (C): Cnot1, Cnot2, or Cnot3 knockdown primarily led to TE differentiation. Principal component analysis (PCA) of embryonic stem cell (ESC) differentiation into three different lineages: pluripotent cells (gray spheres), TE differentiation time course and TE cells (blue spheres), PE differentiation time course (green spheres), and neural ectoderm differentiation time course (orange spheres). The three lineage-specific differentiation time courses form a tripod like structure in the PCA space (represented by the arrows). Cnot1 (C1), Cnot2 (C2), or Cnot3 (C3) silencing (red spheres) clustered closely to TE cells (blue). (D): Cdx2 overexpression and Cnot1, Cnot2, or Cnot3 knockdown resulted in similar gene expression changes. Two-dimensional matrix and heat map depicting gene expression changes in Cdx2-overexpression (Cdx2-OE) and Cnot1 (Cnot1-KD), Cnot2 (Cnot2-KD), or Cnot3 (Cnot3-KD) knockdowns, compared with control ESCs. Axes indicate degree of fold change, from nil (middle of axis) to greater than 1.5-fold (outermost square). Numbers indicate the median fold change of genes in each column or row. The intensity of each square represents the number of genes that fall in that square. The Pearson's correlation coefficients for the plots are: 0.24 for Cnot1-KD versus Cdx2-OE, 0.22 for Cnot2-KD versus Cdx2-OE, and 0.34 for Cnot3-KD versus Cdx2-OE. Abbreviations: KD, knockdown; NE, neuroectoderm; PE, primitive endoderm; TE, trophectoderm; TS, trophoblast stem.

