
Figure 5.
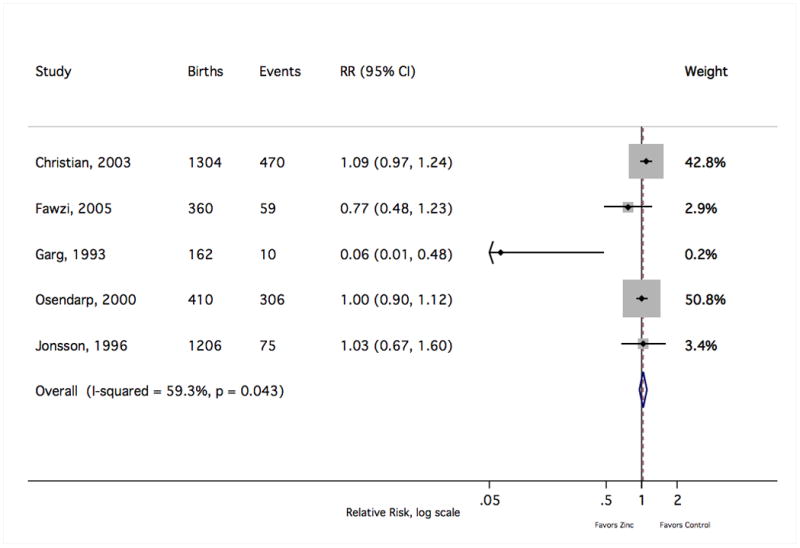
The forest plot graphically depicts the individual results included in meta-analysis. Sizes of the boxes are proportional to the weight assigned in calculating the fixed-effects sRR, where weight was assigned inversely to variance. Results to the left of relative risk = 1 indicate a lower risk of a SGA birth with zinc supplementation. Events indicate the number of SGA births. RR, relative risk; CI, confidence interval.