
Figure 9.
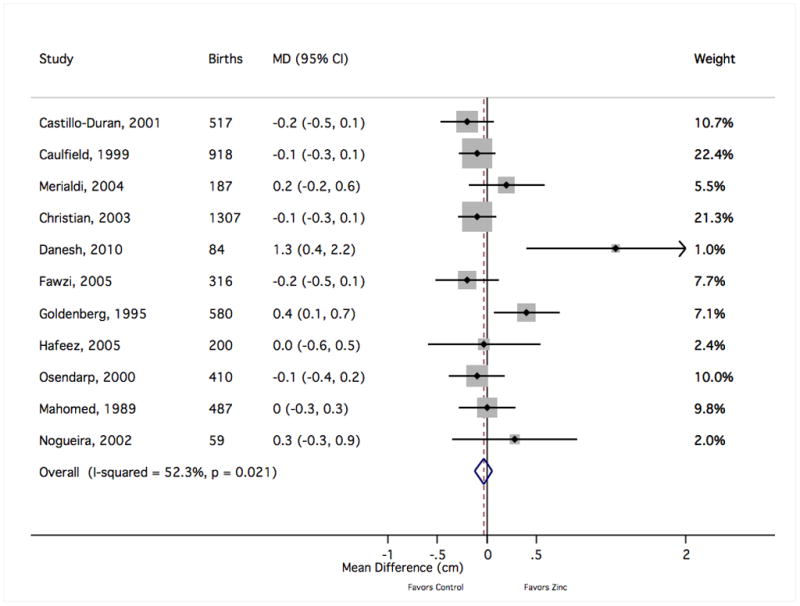
The forest plot graphically depicts the individual results included in meta-analysis. Sizes of the boxes are proportional to the weight assigned in calculating the fixed-effects sMD, where weight was assigned inversely to variance. Results to the right of mean difference = 0 indicate greater mean head circumference with zinc supplementation (in centimeters). MD, mean difference; CI, confidence interval.