
Fig. 2.
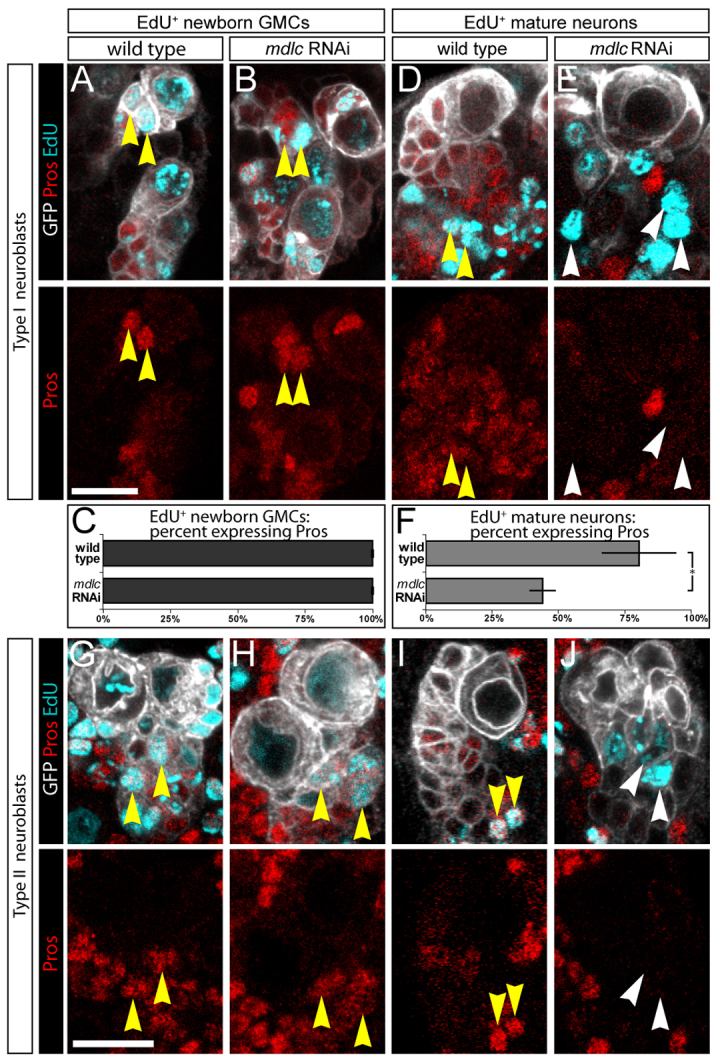
mdlc RNAi results in repression of Pros in postmitotic neurons. (A-F) Type I neuroblasts. (A-C) Newly born GMCs marked by a 4-hour pulse of EdU and immediately stained; both wt GMCs (A) and mdlc RNAi GMCs (B) are Pros+, as quantified in C. n=304 EdU+ cells in wt and n=99 EdU+ cells in mdlc RNAi, 100% of which were Pros+. (D-F) Mature neurons marked by a 4-hour pulse of EdU followed by a 36-hour EdU-free chase; wt neurons are Pros+ (D) whereas mdlc RNAi neurons (E) fail to maintain Pros, as quantified in F. n=1016 EdU+ cells in wt, 79% of which were Pros+; n=438 EdU+ cells in mdlc RNAi brains, 44% of which were Pros+. *P<0.01; error bars indicate s.d. (G-J) Type II neuroblasts. (G,H) Newly born GMCs marked by a 4-hour pulse of EdU and immediately stained; both wt GMCs (G) and mdlc RNAi GMCs (H) are Pros+. (I,J) Mature neurons marked by a 4-hour pulse of EdU followed by a 36-hour EdU-free chase; wt neurons are Pros+ (I) whereas mdlc RNAi neurons (J) fail to maintain Pros. All yellow arrowheads mark EdU+ Pros+ cells; all white arrowheads mark EdU+ Pros- cells. Scale bars: 10 μm.