Figure 3.
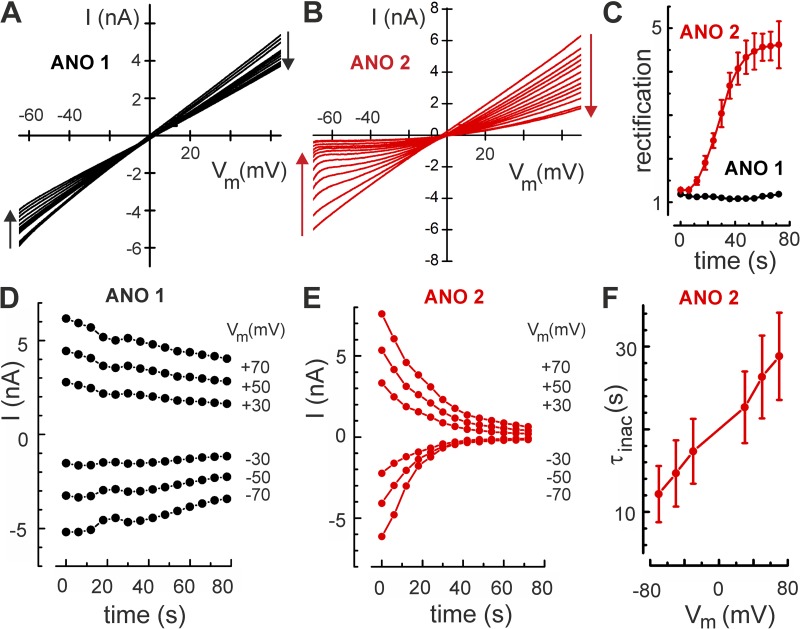
Inactivation of ANO 2 currents. (A) Current-to-voltage (I/Vm) relations, obtained from 14 consecutive 1-s voltage ramps recorded at 5-s intervals from an ANO 1–expressing cell show a slow decline of whole-cell current in the absence of Cl− depletion. (B) The same experimental protocol reveals a faster current decline in a cell expressing ANO 2 channels. (C) Over the 80-s duration of the experiment, the current rectification ratio (I+70 mV/I−70 mV) steadily increased in ANO 2, but remained near unity (no rectification) in ANO 1. (D) The time course of current decline at the indicated voltages reveals a slow inactivation process in ANO 1, with ∼10% loss over 80 s. (E) In an ANO 2–expressing cell, the time course of current decline illustrates almost complete inactivation within 60 s. (F) The time constant of the single-exponential decay of ANO-2 currents was voltage dependent (means of five cells). Error bars indicate mean ± SEM.

