Figure 6.
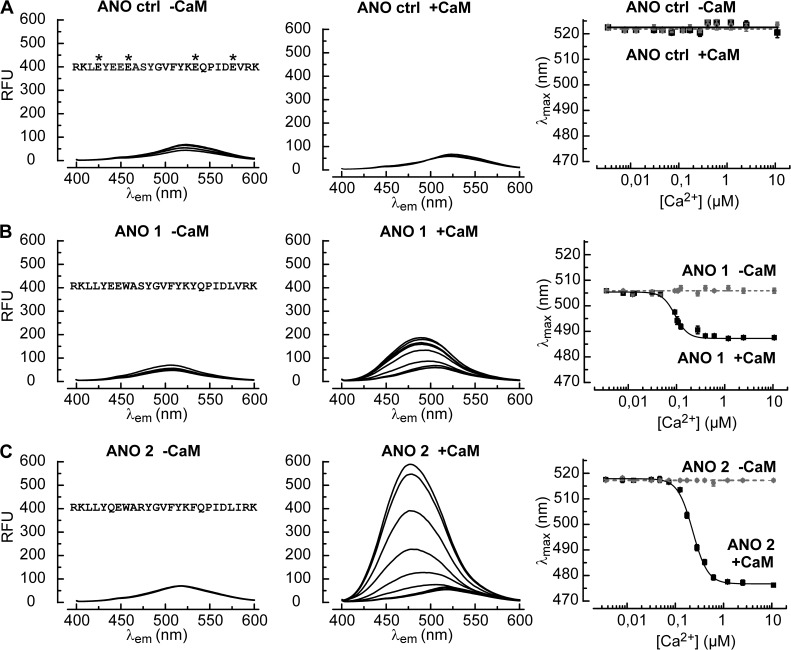
CaM binds to RCBM peptides at low Ca2+ concentrations. (A) Fluorescence emission spectra of the Badan-labeled control peptide (3 µM) without CaM (−CaM, left) and in the presence of 1.5 µM CaM (+CaM, middle). The free Ca2+ concentrations ranged from 0.007 to 10 µM. Spectra did not change with the Ca2+ level. Asterisks indicate the four point mutations used to perturb CaM binding. The diagram on the right displays the dependence of the wavelength for maximal emission (λmax) on the Ca2+ concentration with (solid line) and without (broken line) CaM. Error bars indicate mean ± SEM. (B) The Badan-labeled RCBM peptide corresponding to ANO 1 responds to increasing Ca2+ in the presence of CaM with a blueshift of the fluorescence emission spectrum and an increase in fluorescence intensity (middle). The dependence of λmax on the Ca2+ concentration (right) is described by a Hill function (solid line) with an EC50 of 0.09 ± 0.01 µM Ca2+ (n = 3) and a Hill coefficient of 3.2 ± 0.6. (C) The ANO 2 peptide displays a stronger response to Ca2+ in the presence of CaM than the ANO 1 peptide, both with respect to the blue-shift of λmax and to the fluorescence intensity. A fit of the Hill function yielded an EC50 of 0.23 ± 0.01 µM Ca2+ (n = 3) and a Hill coefficient of 2.8 ± 0.2 (right).

