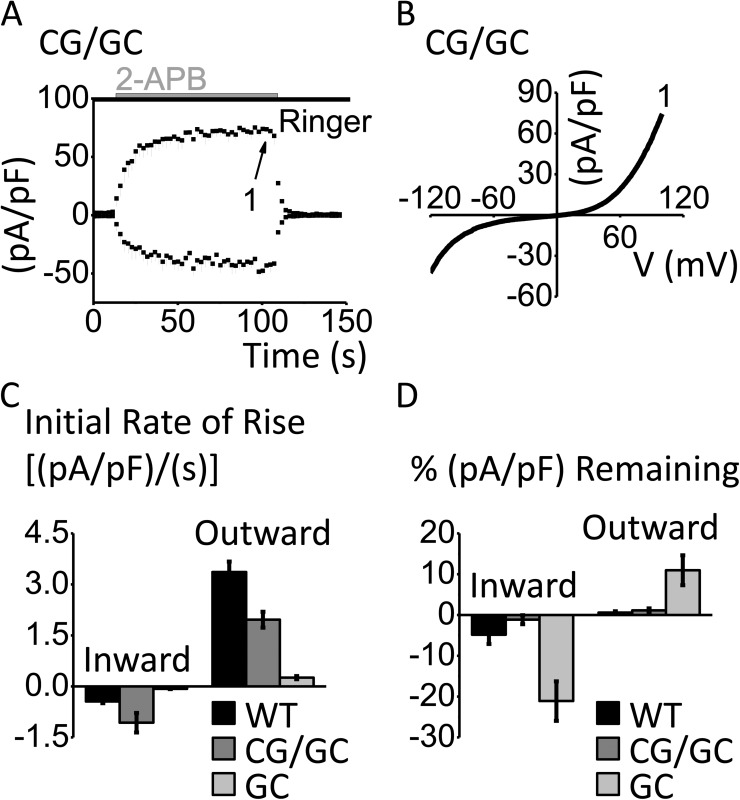
Figure 4.
Double mutant Orai3-C101G/G158C abrogates the slow G158C phenotype. (A) Time course of Orai3-C101G/G158C (CG/GC), activated by 100 µM 2-APB (n = 3), represented as mean current density ± SEM (pA/pF) versus time (s). For clarity, only minus SEM is shown. (B) I-V relationship corresponding to labeled time point in A. (C) Bar graph summarizing rise of inward and outward components of the 2-APB–activated current density (pA/pF) over time (s; first 30 s after solution exchange) for Orai3-WT (WT; n = 4), Orai3-C101G/G158C (CG/GC; n = 3), and Orai3-G158C (GC; n = 4). Values for WT and GC are taken from Fig. 1 I. (D) Bar graph summarizing percent current density (pA/pF) remaining 40 s after 2-APB washout compared with current density recorded before 2-APB washout for WT, CG/GC, and GC. Values for WT and GC are taken from Fig. 1 K. Error bars show SEM.

