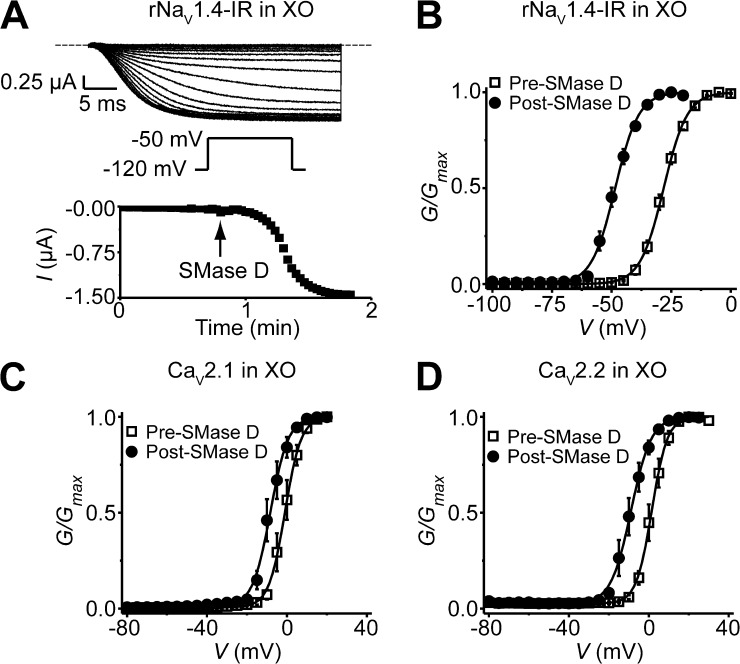
Figure 4.
SMase D shifts the G-V curves of NaV and CaV channels expressed in Xenopus oocytes in the hyperpolarized direction. (A) NaV1.4-IR currents elicited by stepping the voltage every 4 s from the −100-mV holding potential to a −120-mV prepulse, and then to the −50-mV test potential; the dashed line indicates the zero current level. After the addition of recombinant SMase D to the bathing solution, the current gradually increased (top). Time course of NaV1.4-IR current increase after the addition of SMase D (bottom). (B–D) G-V curves before (squares) and after (circles) treatment with SMase D for NaV1.4-IR (B), CaV2.1 (C), and CaV2.2 (D), where all data are presented as means ± SEM (n = 3–9). The curves are fits of Boltzmann functions, yielding the midpoint (V1/2) of −28.2 ± 0.4 mV and the apparent valence (Z) of 5.2 ± 0.1 (open squares), or V1/2 = −48.5 ± 0.2 mV and Z = 5.2 ± 0.2 (closed circles) for B; V1/2 = −1.0 ± 0.1 mV and Z = 6.3 ± 0.2 (open squares), or V1/2 = −8.4 ± 0.2 mV and Z = 5.6 ± 0.3 (closed circles) for C; V1/2 = 1.5 ± 0.1 mV and Z = 6.6 ± 0.2 (open squares), or V1/2 = −8.9 ± 0.2 mV and Z = 5.1 ± 0.2 (closed circles) for D.

