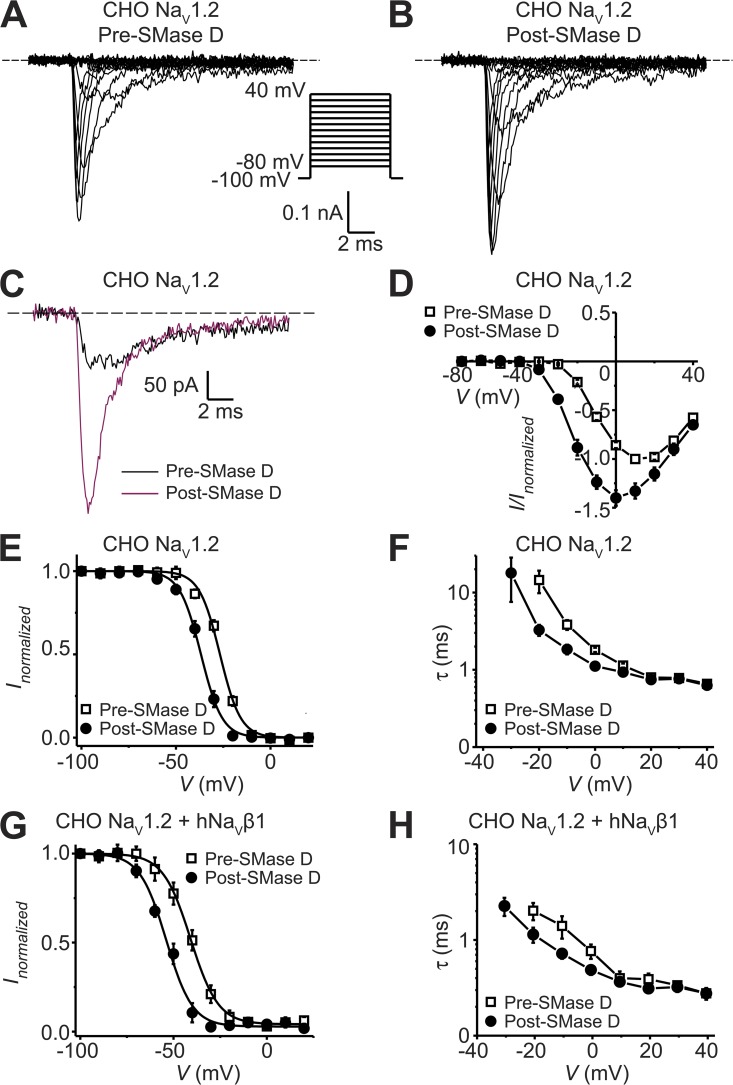
Figure 7.
Effect of SMase D on native NaV channels in CHO cells. (A–C) NaV currents from a CHO cell before (A) and after (B) the addition of SMase D, elicited by stepping the membrane voltage from the −100-mV holding voltage to various test potentials between −80 and 40 mV in 10-mV increments. The current traces at −20 mV from A (black) and B (maroon) are superimposed in C. Dashed lines indicate zero current levels. (D) I-V relations before (open squares) and after (closed circles) SMase D treatment; all data are presented as means ± SEM (n = 5). (E–H) Steady-state inactivation curves (E and G) and voltage dependence of inactivation time constants (F and H) from cells expressing (G and H) or not expressing (E and F) hNaVβ1 before (open squares) and after (closed circles) SMase D treatment; all data are presented as means ± SEM (n = 5). Curves are fits to single Boltzmann functions, yielding V1/2 = −26.8 ± 0.4 mV and Z = 4.7 ± 0.3 (open squares), and V1/2 = −36.8 ± 0.3 mV and Z = 4.6 ± 0.2 (closed circles) in E; and V1/2 = −40.9 ± 0.4 mV and Z = 3.5 ± 0.2 (open squares), and V1/2 = −53.9 ± 0.7 mV and Z = 3.6 ± 0.3 (closed circles) in G.

