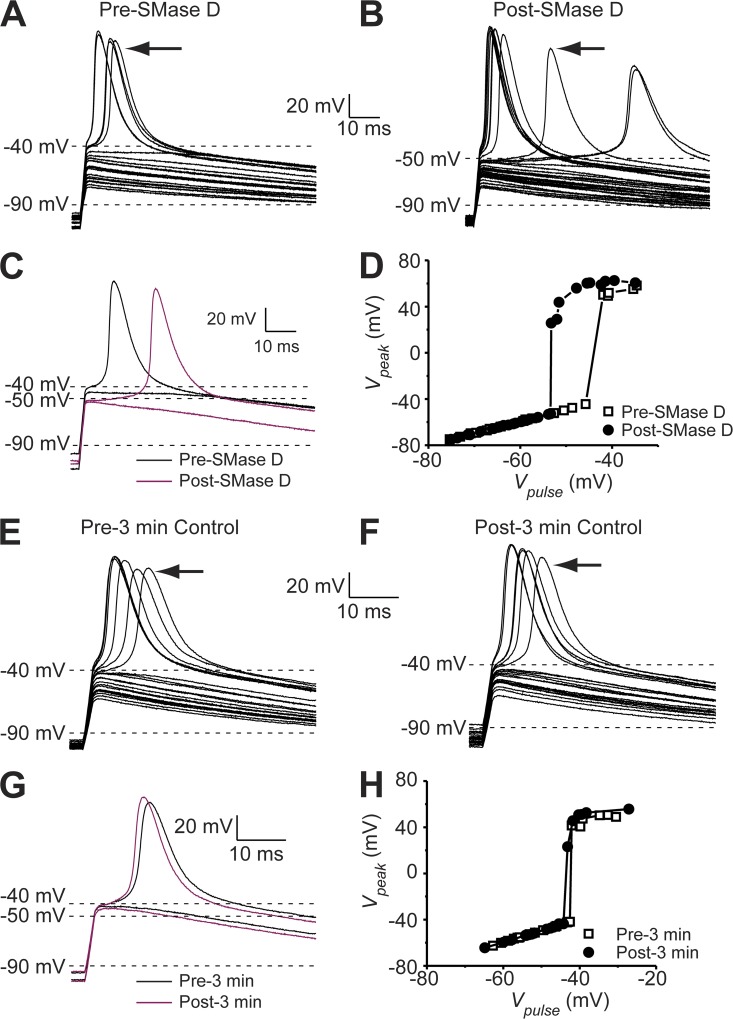
Figure 9.
SMase D shifts the action potential threshold of N2A cells in the hyperpolarized direction. (A–C) Passive voltage responses and action potentials of an N2A cell elicited by several series of 2-ms current pulses between ∼200 and 500 pA in 30-pA increments before (A) and after (B) 3-min SMase D treatment. The action potentials indicated by arrows and the most depolarized passive voltage responses are replotted as black (A) and maroon (B) curves in C. (D) Peak voltages (A, open squares, and B, closed circles) plotted against the instantaneous voltage at the end of the 2-ms current pulse. (E–G) Passive voltage responses and action potentials of an N2A cell elicited by several series of 2-ms current pulses between ∼200 and 500 pA in 30-pA increments before (E) and after (F) 3-min control in the absence of SMase D treatment. The action potentials indicated by arrows and the most depolarized passive voltage responses are replotted as black (E) and maroon (F) curves in G. (H) Peak voltages (E, open squares, and F, closed circles) plotted against the instantaneous voltage at the end of the 2-ms current pulse.

