Figure 7.

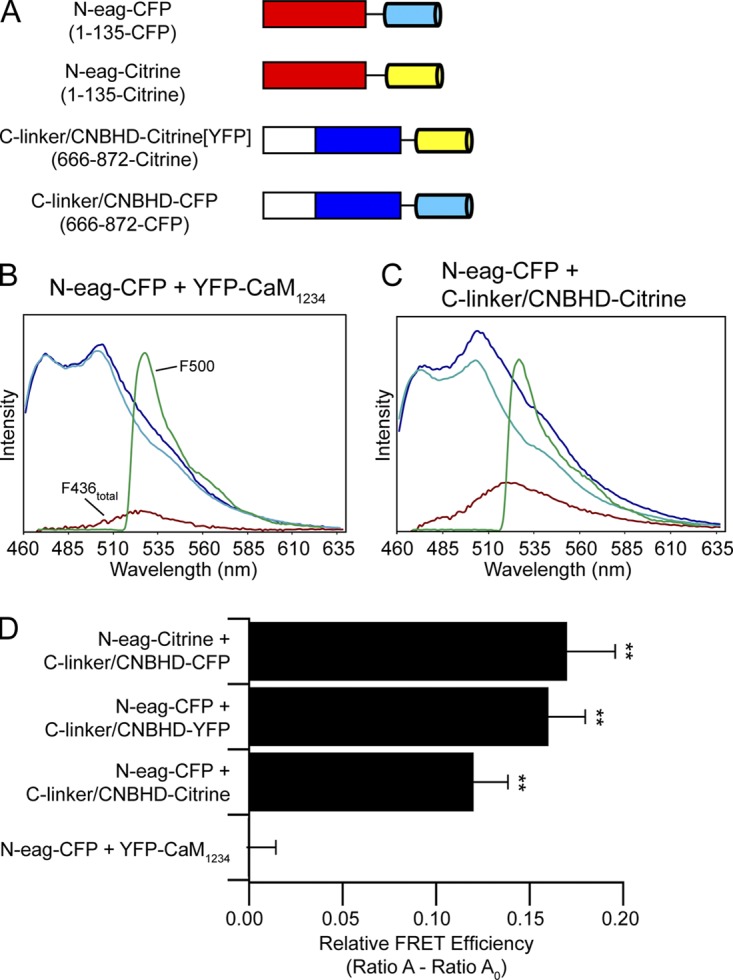
FRET two-hybrid analysis reveals that the eag domain directly interacts with the CNBHD. (A) Schematic illustrating hERG gene fragments used in the FRET two-hybrid assay. CFP is shown in cyan, and Citrine (or YFP) is shown in yellow. Representative emission spectra from cells expressing the bait-prey pairs (B) N-eag-CFP + YFP-CaM1234 or (C) N-eag-CFP + C-linker/CNBHD-Citrine. The dark blue trace represents the total emission spectrum with 436-nm excitation. The cyan trace represents the CFP emission with 436-nm excitation taken from cells expressing “bait” only (N-eag-CFP). The red trace is the subtracted spectrum (difference between the dark blue and cyan traces) and represents the Citrine emission with 436-nm excitation. The green trace represents Citrine emission with 500-nm excitation. (D) Histogram of Ratio A–Ratio A0 values of each bait-prey pair. Data are plotted as mean ± SEM and are given in Table S3. **, P < 0.01 versus N-eag-CFP + YFP-CaM1234 (ANOVA). n ≥ 6 for each.
