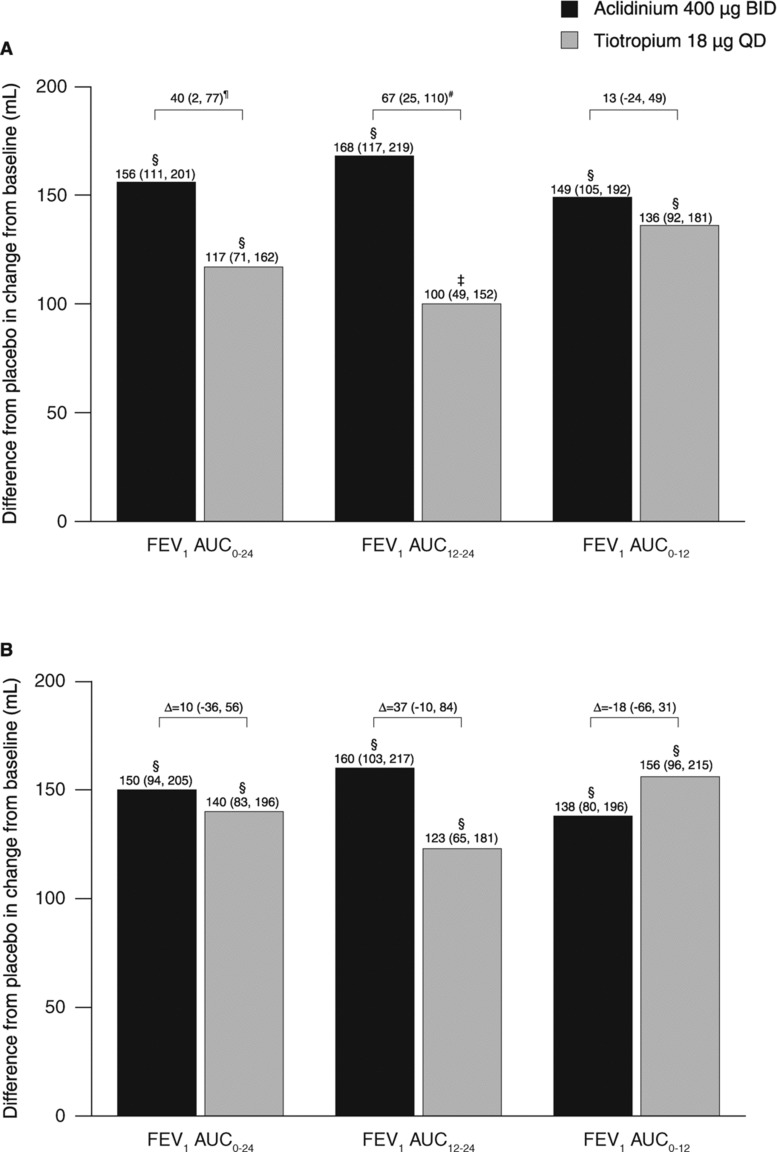
Figure 2.
Change from baseline in FEV1 AUC0–24, FEV1 AUC12–24, and FEV1 AUC0–12 compared with placebo (A) on day 1 and (B) at week 6 (ITT population). Data reported as LS mean (95% CI) differences from placebo (ANCOVA). ‡p < 0.001; §p < 0.0001 for aclidinium or tiotropium versus placebo. ¶p < 0.05; #p < 0.01 for aclidinium versus tiotropium. ANCOVA, analysis of covariance; AUC, area under the curve; AUC0–24, AUC over the 24-hour period post-morning treatment; AUC12–24, AUC over the nighttime period; AUC0–12, AUC for the 12-hour period post-morning treatment; BID, twice daily; CI, confidence interval; FEV1, forced expiratory volume in 1 second; ITT, intent-to-treat; LS, least squares; QD, once daily.

