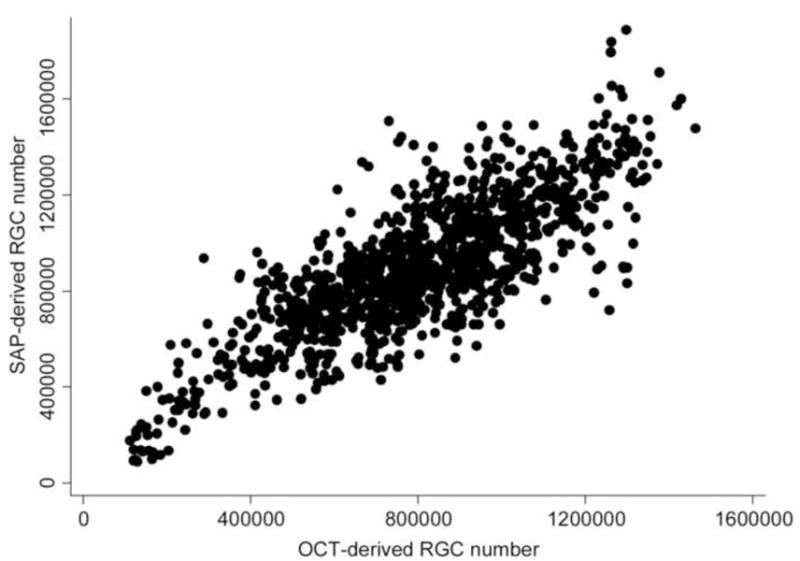
Figure 1.

Scatterplot illustrating the relationship between estimates of the number of retinal ganglion cells (RGC) obtained by standard automated perimetry (SAP) and optical coherence tomography (OCT).

Scatterplot illustrating the relationship between estimates of the number of retinal ganglion cells (RGC) obtained by standard automated perimetry (SAP) and optical coherence tomography (OCT).