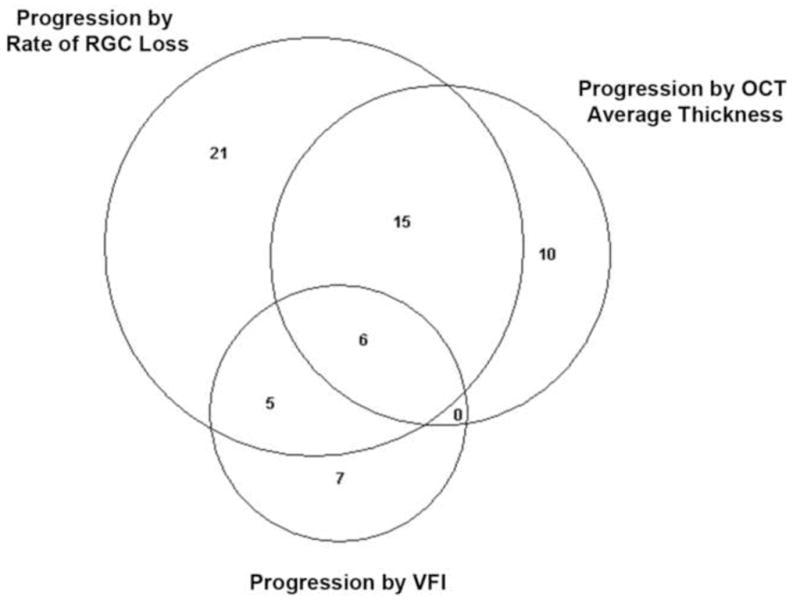
Figure 3.

Proportional Venn diagram illustrating the number of eyes detected as progressing according to the rates of retinal ganglion cell (RGC) loss, optical coherence tomography (OCT) average thickness parameter and standard automated perimetry visual field index (VFI).
