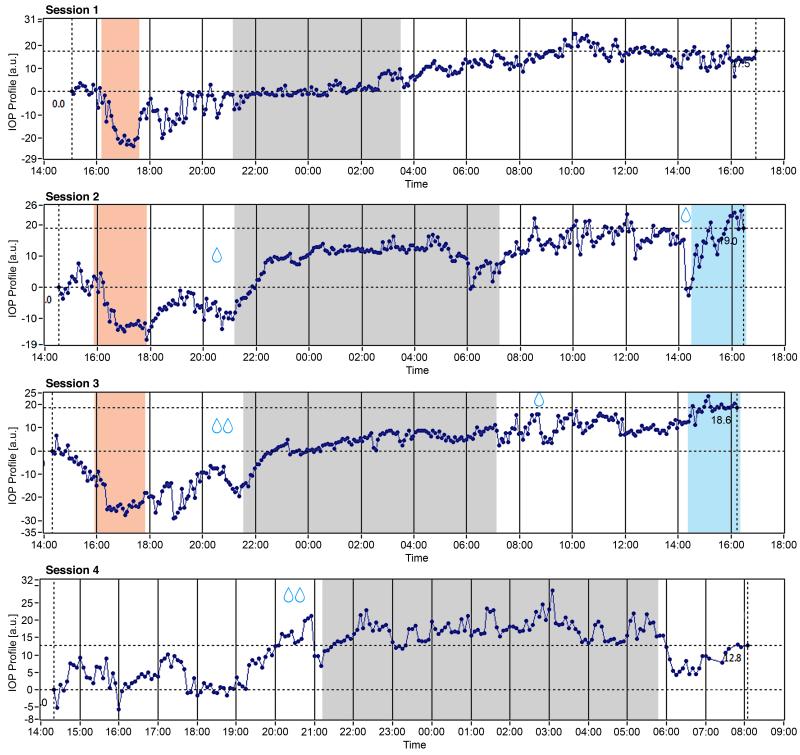
Figure 1.
Results of 26-h monitoring of IOP patterns at four different sessions, each 1 month apart. A characteristic pattern of signal drop and subsequent increase is observed at sessions 1 to 3 with the time course corresponding to reported times of consumption of Champagne wine followed by sexual activity. At session 4, this pattern was absent. Red-shaded zones correspond to the duration of sexual activity, grey-shaded zones to the sleep period, and blue-shaded zones to the 2-hour period following the water drinking test. Drop signs indicate the time when intraocular pressure-lowering eyedrops were applied.

