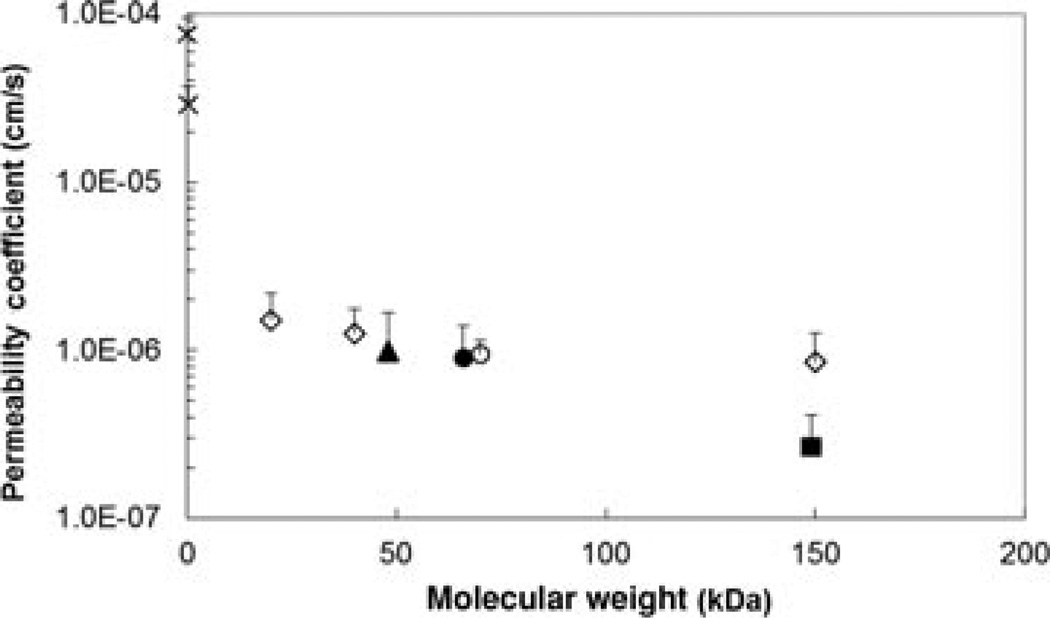
Figure 4.
Relationship between the steady-state permeability coefficients and molecular weights of permeants in the human sclera transport experiment. The permeability coefficient data of urea and atenolol are obtained from a previous study.22 Symbols: closed square, bevacizumab; closed triangle, ranibizumab; closed circle, FITC-BSA; open circle, FITC-ficoll 70 kDa; open diamonds, FITC-dextrans 20, 40, and 150 kDa; crosses, urea and atenolol. Data represent the mean and standard deviation of at least three sclera samples for each permeant.

