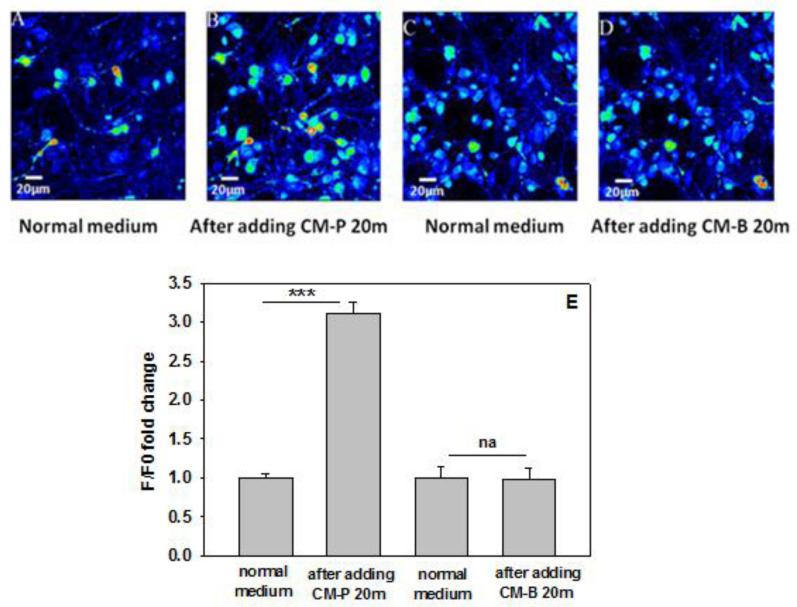
Figure 1. Calcium imaging of neurons in response to conditioned media from astrocytes.
(A) Representative fluorescence image of primary neurons cultured with normal cell culture media, after capturing the image, the normal cell cultured media was replaced with conditioned media from astrocytes cultured in palmitate (CM-P) for 20min, and the image of the same field of view as (A) was captured and presented in (B). (C) Representative image of primary neurons cultured with normal cell culture media, after capturing the image, the normal cell cultured media was replaced with control conditioned media from astrocytes cultured in DMEM/BSA (CM-B) for 20min, then the image of the same field of view as (C) was captured and presented in (D). Fluorescence images represented by a spectral table; the warmer colors indicate the higher fluorescence intensities and cooler colors indicate the lower fluorescence intensities. (E) Relative signal intensity (F/F0) with Fluo-4 loaded neurons cultured with conditioned media from astrocytes. The fluorescence intensity was measured with a plate reader. ***p<0.001. A line indicates a comparison between the 2 bars connected by the line.

