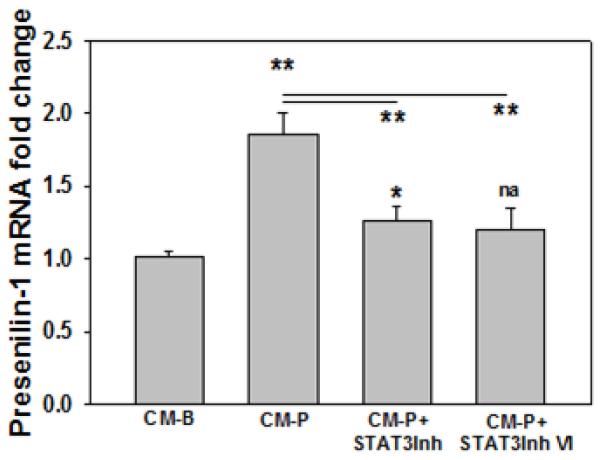
Figure 8. Presenilin-1 expression in neurons.
Primary neurons were cultured in conditioned media CM-B (control), CM-P or CM-P plus STAT3 inhibitor or STAT3 inhibitor VI (CM-P+STAT3Inh at 235μM, CM-P+STAT3Inh VI at 100μM, respectively) for 12hr. Then the cells were lysed and the mRNA level of presenilin-1 was monitored by real-time PCR. The results were normalized to control (CM-B), and * or na (not significant) above the bar indicates the significance. A line indicates comparison between the 2 bars connected by the line. (n=3). *p<0.05, **p<0.01, ***p<0.001.

