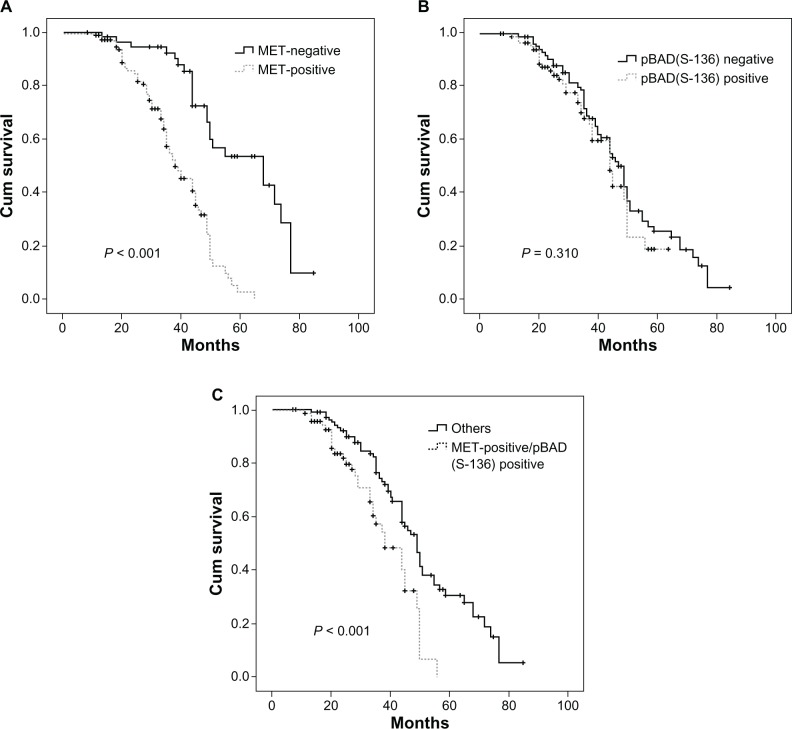
Figure 3.
Kaplan–Meier survival analysis. (A) Overall survival curves for patients with MET-positive and MET-negative expression (P < 0.001). (B) Overall survival curves for patients with phospho-BAD(Ser-136)-positive and phospho-BAD(Ser-136)-negative expression (P = 0.310). (C) Overall survival curves for patients with MET+/phospho-BaD(Ser-136)+ and other phenotypes (P < 0.001).

