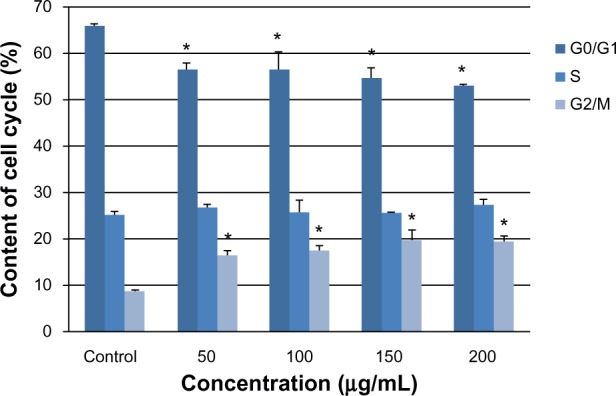
Figure 4.

G2/M phase cell cycle arrest of L-02 cells induced by silica nanoparticles. After exposure to 50, 100, 150, and 200 μg/mL silica nanoparticles for 24 hours, the L-02 cell cycle was determined by flow cytometry. As the silica dose increased, the percentage of cells in G0/G1 phase decreased and the percentage of cells in G2/M phase increased significantly. Data are expressed as the mean ± standard deviation of three independent experiments. *P < 0.05 versus control group using analysis of variance.
