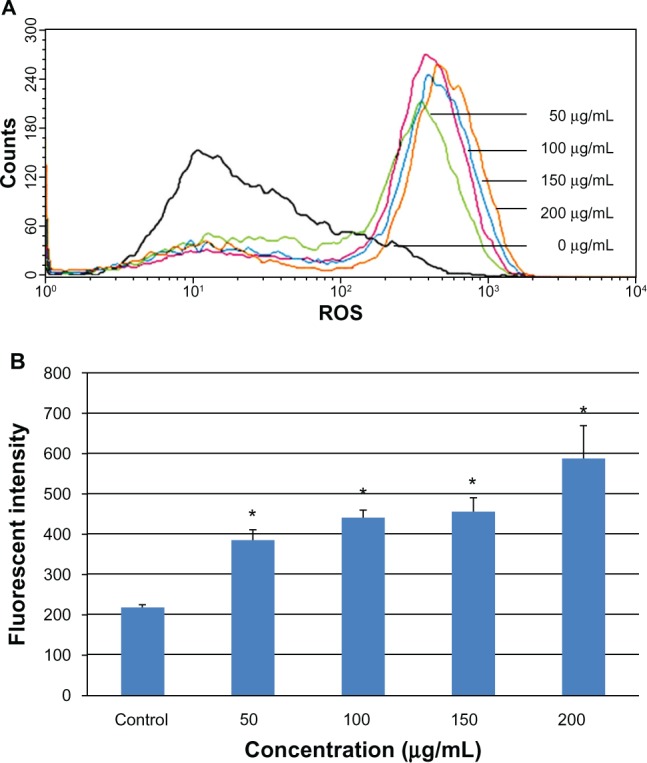
Figure 5.

Change in intracellular ROS levels in L-02 cells after 24 hours of incubation with different concentrations of silica nanoparticles. The results of flow cytometry (A) and the corresponding bar graph (B) are shown. Intracellular ROS levels increased in a dose-dependent manner. Data are expressed as the mean ± standard deviation of three independent experiments. *P < 0.05 versus control group using analysis of variance.
Abbreviation: ROS, reactive oxygen species.
