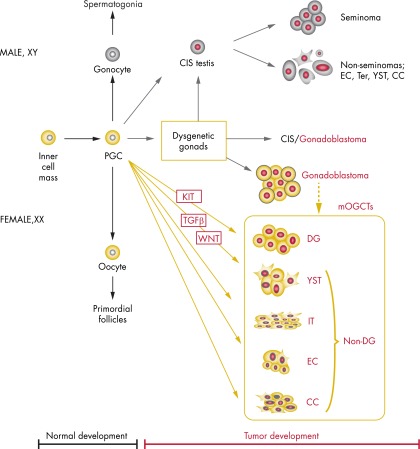
Figure 1.
A simplified diagram illustrating the development of GCT. The main aberrant signaling pathways and ploidy levels identified in this paper are indicated. Development from zygote via PGC to normal oocyte or to mOGCT and TGCT is also shown. For the description of DSD patient groups with gonadal dysgenesis and increased risk for GCT, see Section I.E. Ter, teratoma.

