
Figure 2.
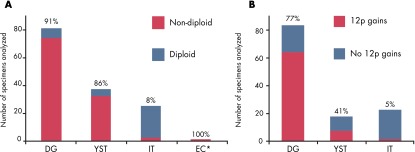
Low-resolution genome instability of mOGCT histological subtypes. A, Results from ploidy analyses from the following 15 articles: Refs. 132 and 135–148. The percentage of nondiploid samples is indicated above each bar. B, DNA copy number gain at chromosome arm 12p, as reported in 8 FISH articles (137, 146, 153, 155–158, 291) and 7 CGH articles (both chromosomal and array-based) (131, 132, 149–152, 340). The percentages of samples with gain at chromosome arm 12p are indicated above each bar. In both plots, the number of cases analyzed is shown on the y-axis. *, EC is represented by only 2 specimens, both nondiploid.