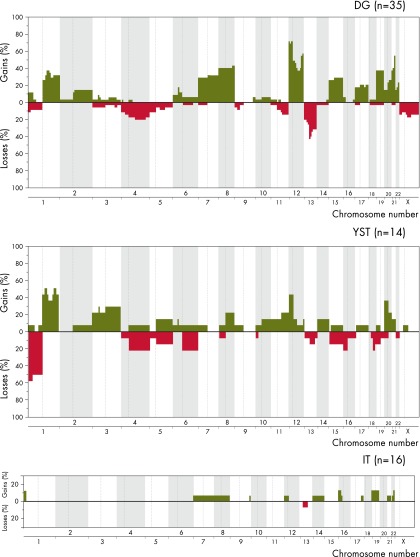
Figure 3.
DNA copy number alterations for histological subtypes of mOGCT as reported by 6 CGH articles (131, 132, 149–152). The percentages of samples with gains and losses are shown in green and red, respectively, on the y-axis. Genomic positions given by the chromosome numbers are indicated along the x-axis. Centromere positions are indicated by vertical, dashed lines, and alterations on the p- and q-arms are mapped to the left and right of the dashed lines, respectively. The different panels summarize the findings per histology for DG (n = 35), YST (n = 14), and IT (n = 16).

