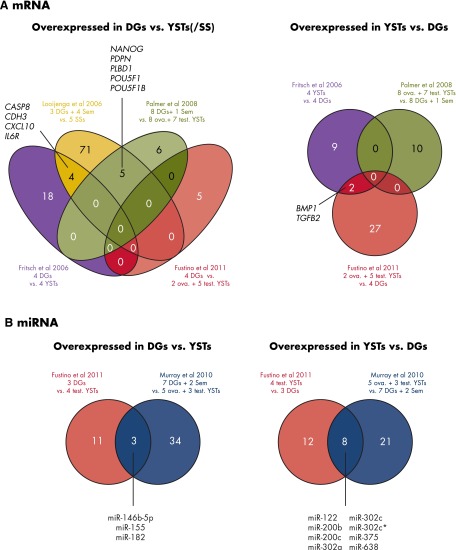
Figure 4.
Overlapping results among genome-wide mRNA and among miRNA expression studies of mOGCTs are shown in Venn diagrams where each number indicates the number of common mRNAs or miRNAs identified as overexpressed. A, To the left, mRNAs overexpressed in DG/seminoma vs other GCT types as described, and to the right, mRNAs overexpressed in YST vs other GCT types as described. B, To the left, miRNA overexpressed in DG/seminoma vs YST, and to the right, miRNAs overexpressed in YST vs DG/seminoma. Abbreviations: ova., ovarian; Sem, seminoma (TGCT histological subtype); test., testicular.

