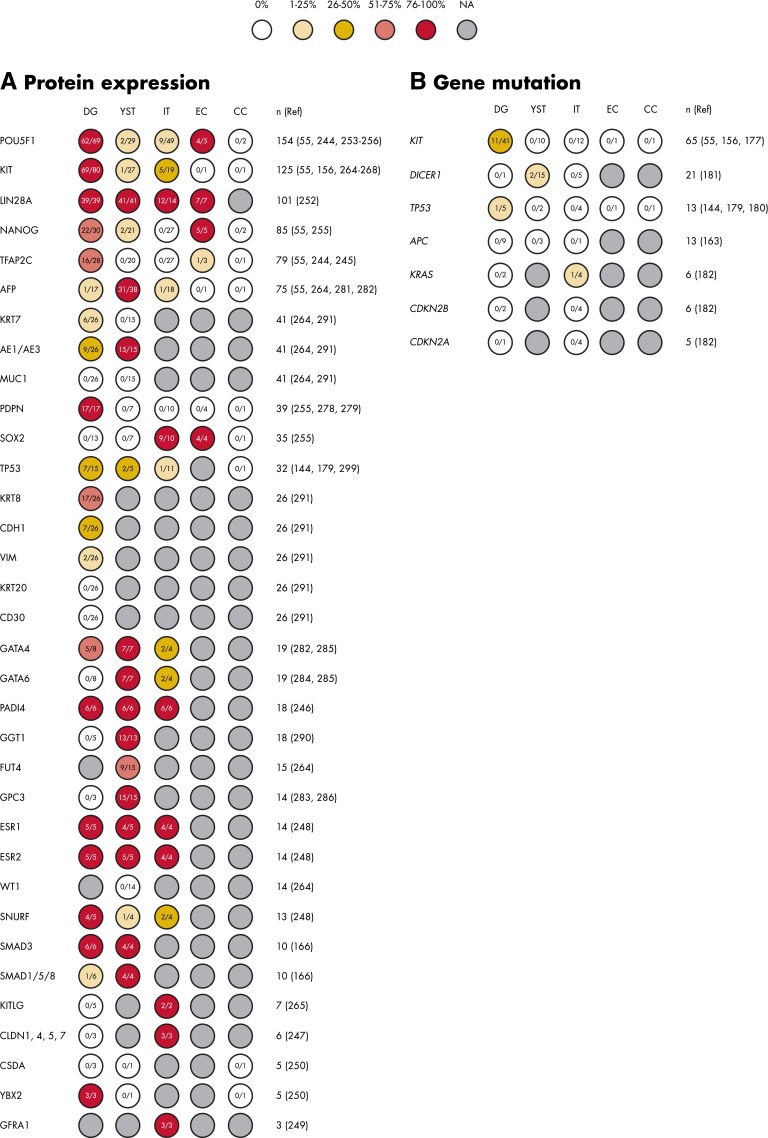
Figure 5.
Overview of single-marker results in mOGCT ordered by number of cases for protein expression (A) and gene mutations (B). The number of cases with positive protein staining or gene mutation of the total number analyzed is shown within each circle. The circles are color-coded according to the percentage of positive staining. The total number of tumors studied (n) for each protein is followed by the relevant references (Ref).

