
Figure 6.
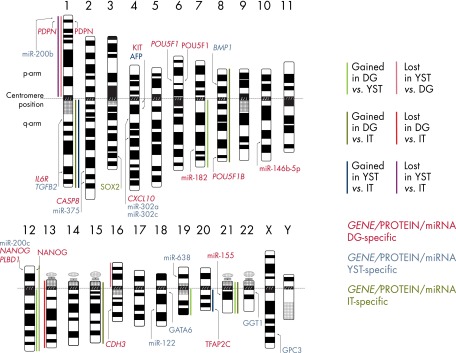
An overview of histology-specific differences in DNA copy number alterations (solid bars), mRNA/miRNA expression (gene names, italics), and protein level (protein names) in mOGCT. Significant differences in DNA copy number gains and losses detected by CGH are presented as colored bars. For DG vs YST, light green bars reflect gains in DG as compared with YST and light red bars reflect losses in YST as compared with DG. For DG vs IT, dark red and dark green bars reflect regions of loss and gain, respectively. The significant gains and losses in YST vs IT are represented by blue and purple bars. Histology-specific gene expression identified from our overlap analysis of microarray results (Figure 4) is indicated to the left of chromosomes. The histology-specific protein expression from IHC studies (Figure 5A) is indicated to the right of chromosomes. The proteins included in the figure are those that were positive in ≥50% of the samples tested and with significantly different expression (P ≤ .02) among histology subtypes. Gene/protein symbols are color-coded according to the histological subtype associated with overexpression.