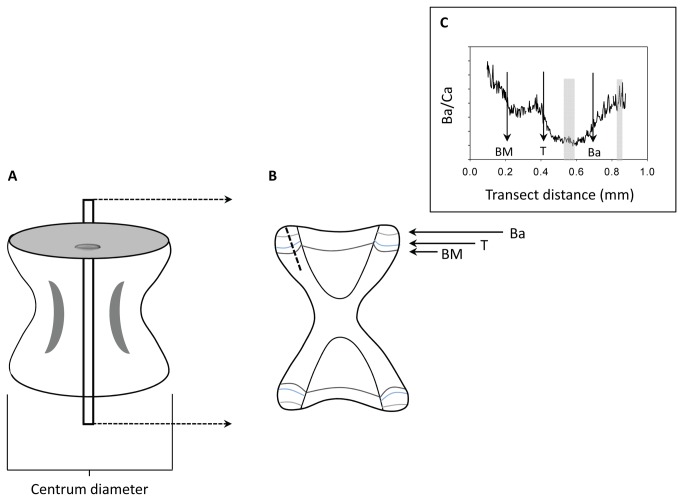
Figure 1. Processing and analysis of vertebral centra.
Depiction of a (A) whole and (B) thin-sectioned vertebral centra and (C) the barium to calcium ratio (Ba/Ca) profile collected along a representative laser transect. The birthmark (BM) provides an intrinsic reference and fluorescent markers injected into round rays (Urobatis halleri) at the beginning of the temperature and barium manipulation experiments provided visual references for identifying specific regions deposited during this study. T represents the beginning of the temperature experiment (indicated by an oxytetracycline mark). Ba represents the beginning of the barium manipulation experiment which was distinguishable by a corresponding calcein mark. The dashed line in (B) exemplifies the transect pathway used for laser ablation. Grey vertical bars within (C) depict the regions integrated for analysis. The example in (C) characterizes the variation in vertebral Ba/Ca of a round ray that was maintained at 18°C and 6x ambient Ba concentration during the temperature and barium manipulation experiments, respectively.

