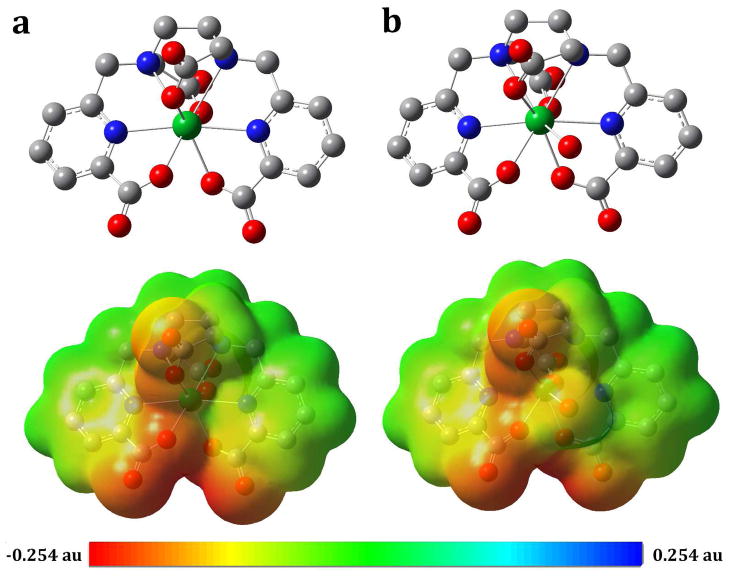
Figure 1. In silico DFT structure predictions.
a, 8-coordinate structure of [Lu(octapa)]−. b, 9-coordinate structure of [Lu(octapa)(H2O)]−, as well as the MEP polar-surface area maps (bottom) predicting the charge distribution over the solvent-exposed surface of the metal complexes (red = negative, blue = positive, representing a maximum potential of 0.254 au and a minimum of −0.254 au, mapped onto electron density isosurfaces of 0.002 Å−3), demonstrating very little difference between the 8- and 9-coordinate solution structures in terms of both geometry and charge distribution, suggesting little change in physical properties between the 8- and 9-coordinate geometries.

